Centralized and dedicated log with Log analytics
Context
When using Kubernetes, you have multiple places where logs are generated:
- your containers
- the k8saas containers
- the kubernetes events (will be available soon)
- the linux nodes that supports the kubernetes nodes
At the end, the centralization of these logs + a strong visualization (and searches) capability help a lot to better understand the workloads that are running and perform diagnostics when an outage happens.
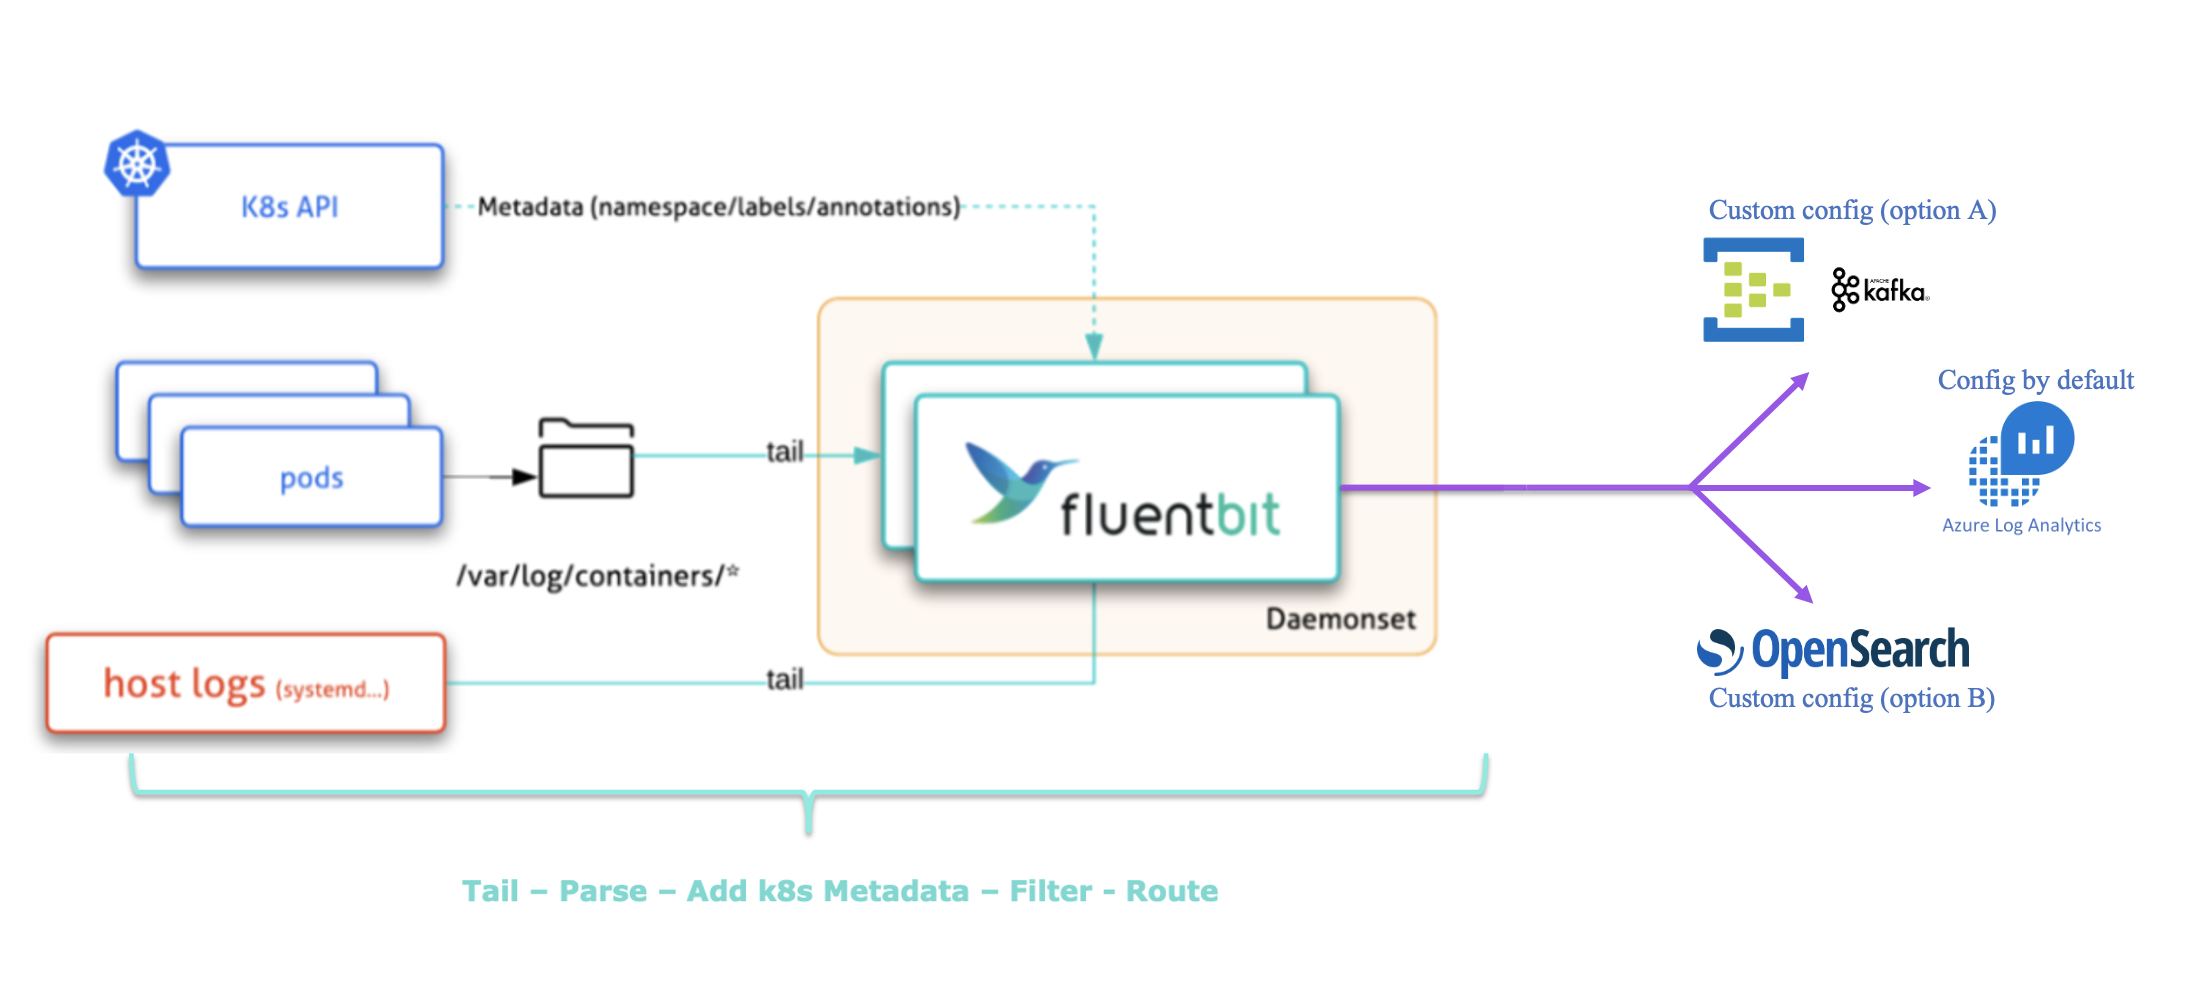
K8SaaS provides a log collection mechanism based on fluentbit as well as a log sink to centralized applicative and kubernetes logs based by default on Azure Log Analytics, or optionally on Opensearch, or optionally on Azure Event Hubs
Use cases
- Security and Monitoring Forensics
- Log based alerting
- Log based dashboarding
What to do ?
Almost nothing ! The service is activated by default to send logs to Azure Log Analytics, however you have the option to ask our team to configure the log collection option: If you want to switch Azure Log Analytics with Opensearch or Azure Event Hub, please submit a request via PostIT.
There are multiples logs generated by the platform:
- AKS itself (through azure diagnostic settings)
- Internal applications (use to manage pod to pod encryption, ingresses, DNS resolution, certificate generation )
- And finally the Customer applications
There is also several needs regarding the actors:
- A Software Developer want to see the application logs to audit the system or perform a diagnostic
- The CSOC Operator want to collect and correlate all the logs to perform security analysis
- The Program Manager wants a service that is the competitive compare to other services in the competition
For all those reasons, we have decided to provide a log collection based on Log Analytics and route the logs regarding the usage.
Here is the high level architecture of the log collection :

Note: from Atik 1.30 all applicative logs are stored in a dedicated cold storage.
HOWTO
Access to your dedicated log analytics workspace
First, get the following information:
- K8SAAS_SUBSCRIPTION_ID
- K8SAAS_RESOURCE_NAME
Then, access to the URLS: <https://portal.azure.com/#@thalesdigital.io/resource/subscriptions/><K8SAAS_SUBSCRIPTION_ID>/resourceGroups/<K8SAAS_RESOURCE_NAME>/providers/Microsoft.OperationalInsights/workspaces/<K8SAAS_RESOURCE_NAME>/log
Please use the Microsoft credential to log in.
You should see :

You should have the Azure RBAC Monitoring Contributor role
Then, to see your logs, right the most basic query
APP_CL
| where TimeGenerated > ago(24h)
| project TimeGenerated, Message
| sort by TimeGenerated desc
You should see the applicative logs
If you want to see the metatada, remove the last line:
APP_CL
| where TimeGenerated > ago(24h)
| sort by TimeGenerated desc
Create a visualization with the logs
Based on the logs you should be able to create a graph by combining aggregations and render function,
For instances:

Or,

Query APP_CL - Application Custom logs
All the stout of your application are collected and send to Azure Log Analytics in a specific table: APP_CL.
APP_CL
| where TimeGenerated > ago(24h)
| project TimeGenerated, Message
| sort by TimeGenerated desc
Query ingress_CL - Ingress Custom logs
All the nginx ingress controller logs are collected and send to Azure Log Analytics in a specific table: ingress_CL
ingress_CL
| where TimeGenerated > ago(24h)
| project TimeGenerated, Message
| sort by TimeGenerated desc
Query waf_CL - WAF Custom logs
All the modsecurity logs are collected and send to Azure Log Analytics in a specific table: waf_CL
waf_CL
| where TimeGenerated > ago(24h)
| project TimeGenerated, Message
| sort by TimeGenerated desc
A manual configuration should be done by the user to point your query to the right log analytics.
Access to your dedicated Opensearch
Prerequistes
- First of all you need to have an ESAAS cluster, otherwise ask our team. More information here
How to visualize logs in Opensearch
Go on your dashboard : os-dashboard.YOUR_CLUSTER_NAME.kaas.thalesdigital.io
click on discover to see all logs :
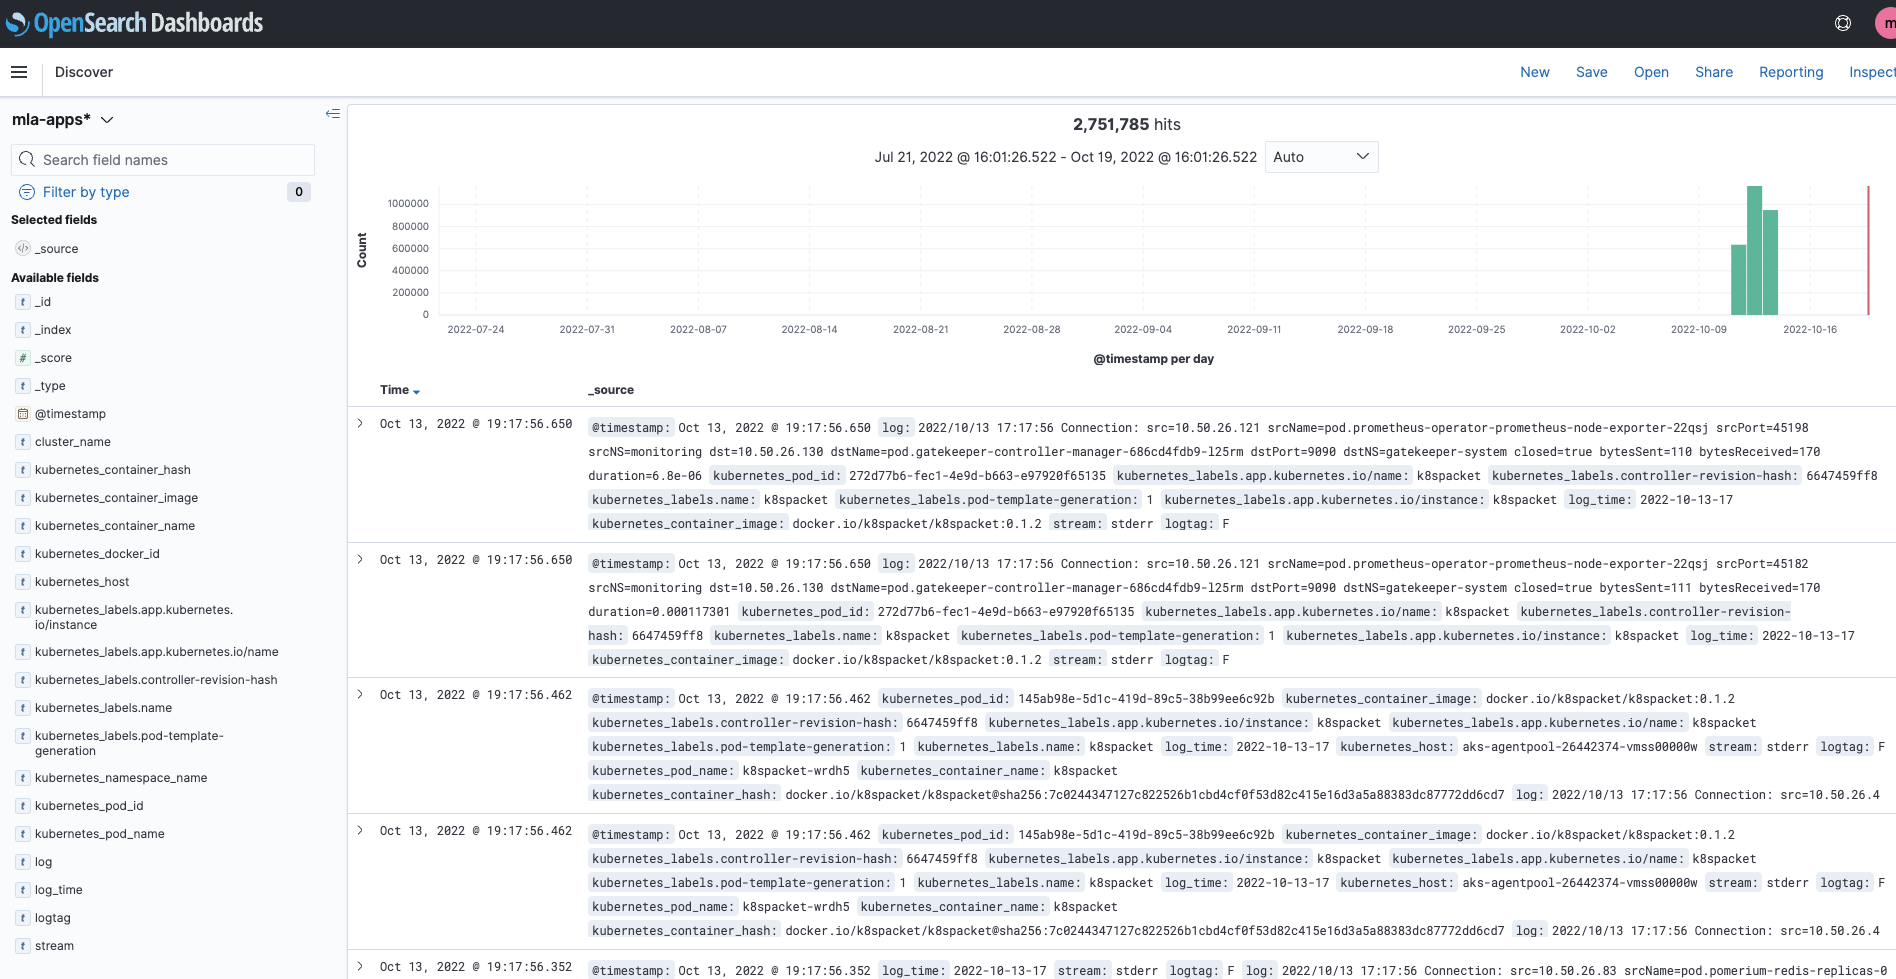
You can also create visualization and dashboard. Look at the official documentation
Access to your dedicated Azure EventHub
Prerequistes
- Ask to our team to deploy Azure EventHub service.
- having the necessary rights on the Azure Eventhub service to get connection string
How to visualize logs in Azure EventHub
There are several ways to manipulate data in Azure EventHub:
- Using Confluent's Python Kafka client and librdkafka with Event Hubs for Apache Kafka Ecosystems Python example
Follow the python consumer example Github python sample
python consumer.py 'group.id' <YOUR_TOPIC>
python consumer.py '$Default' k8saas-XXXXX-env
Output
b'{"@timestamp":1666103581.158348,"kubernetes_host":"aks-agentpool-26442374-vmss00000w","kubernetes_pod_name":"k8spacket-7ncph","kubernetes_container_name":"k8spacket","log":"2022/10/18 14:33:01 Connection: src=10.50.26.4 srcName=pod.prometheus-operator-prometheus-node-exporter-99sgv srcPort=36936 srcNS=monitoring dst=10.50.26.17 dstName=pod.coredns-autoscaler-549489f84f-854m6 dstPort=8080 dstNS=kube-system closed=true bytesSent=112 bytesReceived=94 duration=6.001e-06","kubernetes_container_hash":"docker.io/k8spacket/k8spacket@sha256:7c0244347127c822526b1cbd4cf0f53d82c415e16d3a5a88383dc87772dd6cd7","kubernetes_pod_id":"abb9375b-5e6b-4f4c-845c-e36bc45cd749","kubernetes_container_image":"docker.io/k8spacket/k8spacket:0.1.2","kubernetes_labels":{"controller-revision-hash":"6647459ff8","pod-template-generation":"1","name":"k8spacket","app.kubernetes.io/instance":"k8spacket","app.kubernetes.io/name":"k8spacket"},"log_time":"2022-10-18-14","kubernetes_docker_id":"f3e84903f3575b7a5921984d1026943a5a6609c2b61146c3fada00101999c93b","kubernetes_namespace_name":"k8spacket","stream":"stderr","logtag":"F","cluster_name":"mla-babel2-sandbox"}
- Using kcat cli :
az login
export INSTANCE_NAME='<YOUR_INSTANCE_NAME>'
export EVENT_HUB_CONN_STR=$(az eventhubs eventhub authorization-rule keys list --resource-group k8saas-$INSTANCE_NAME --namespace-name k8saas-$INSTANCE_NAME --eventhub-name k8saas-$INSTANCE_NAME --name $INSTANCE_NAME-customer | jq -r .primaryConnectionString)
export USERNAMEAZ='$ConnectionString'
export BROKERS='<YOUR_INSTANCE_NAME>.servicebus.windows.net:9093'
export TOPICS='<YOUR_TOPIC>'

kcat -b $BROKERS -C -t test -X security.protocol=SASL_SSL -X sasl.mechanisms=PLAIN -X sasl.username=$USERNAMEAZ -X sasl.password=$EVENT_HUB_CONN_STR -t $TOPICS
Output
{"@timestamp":1666101104.906258,"kubernetes_pod_name":"k8spacket-7ncph","kubernetes_namespace_name":"k8spacket","log_time":"2022-10-18-13","kubernetes_pod_id":"abb9375b-5e6b-4f4c-845c-e36bc45cd749","kubernetes_container_hash":"docker.io/k8spacket/k8spacket@sha256:7c0244347127c822526b1cbd4cf0f53d82c415e16d3a5a88383dc87772dd6cd7","kubernetes_labels":{"pod-template-generation":"1","app.kubernetes.io/instance":"k8spacket","app.kubernetes.io/name":"k8spacket","controller-revision-hash":"6647459ff8","name":"k8spacket"},"log":"2022/10/18 13:51:44 Connection: src=10.50.26.4 srcName=pod.prometheus-operator-prometheus-node-exporter-99sgv srcPort=16836 srcNS=monitoring dst=10.50.26.27 dstName=pod.pomerium-proxy-655694d69b-stvj7 dstPort=80 dstNS=k8saas-system closed=true bytesSent=0 bytesReceived=0 duration=6.011944513","kubernetes_container_image":"docker.io/k8spacket/k8spacket:0.1.2","kubernetes_docker_id":"f3e84903f3575b7a5921984d1026943a5a6609c2b61146c3fada00101999c93b","stream":"stderr","logtag":"F","kubernetes_container_name":"k8spacket","kubernetes_host":"aks-agentpool-26442374-vmss00000w","cluster_name":"mla-babel2-sandbox"}
You are free to use any events visualization, more examples here
Use built-in k8saas grafana dashboards
K8SAAS provides built-in dashboard to facilitate the usage of these logs, but you have to configure few permissions on your side. This documentation explains how to do.
Let's use the K8saas / Azure Log Analytics:
First, go to dashboard tab, and search for azure tag. You should see:
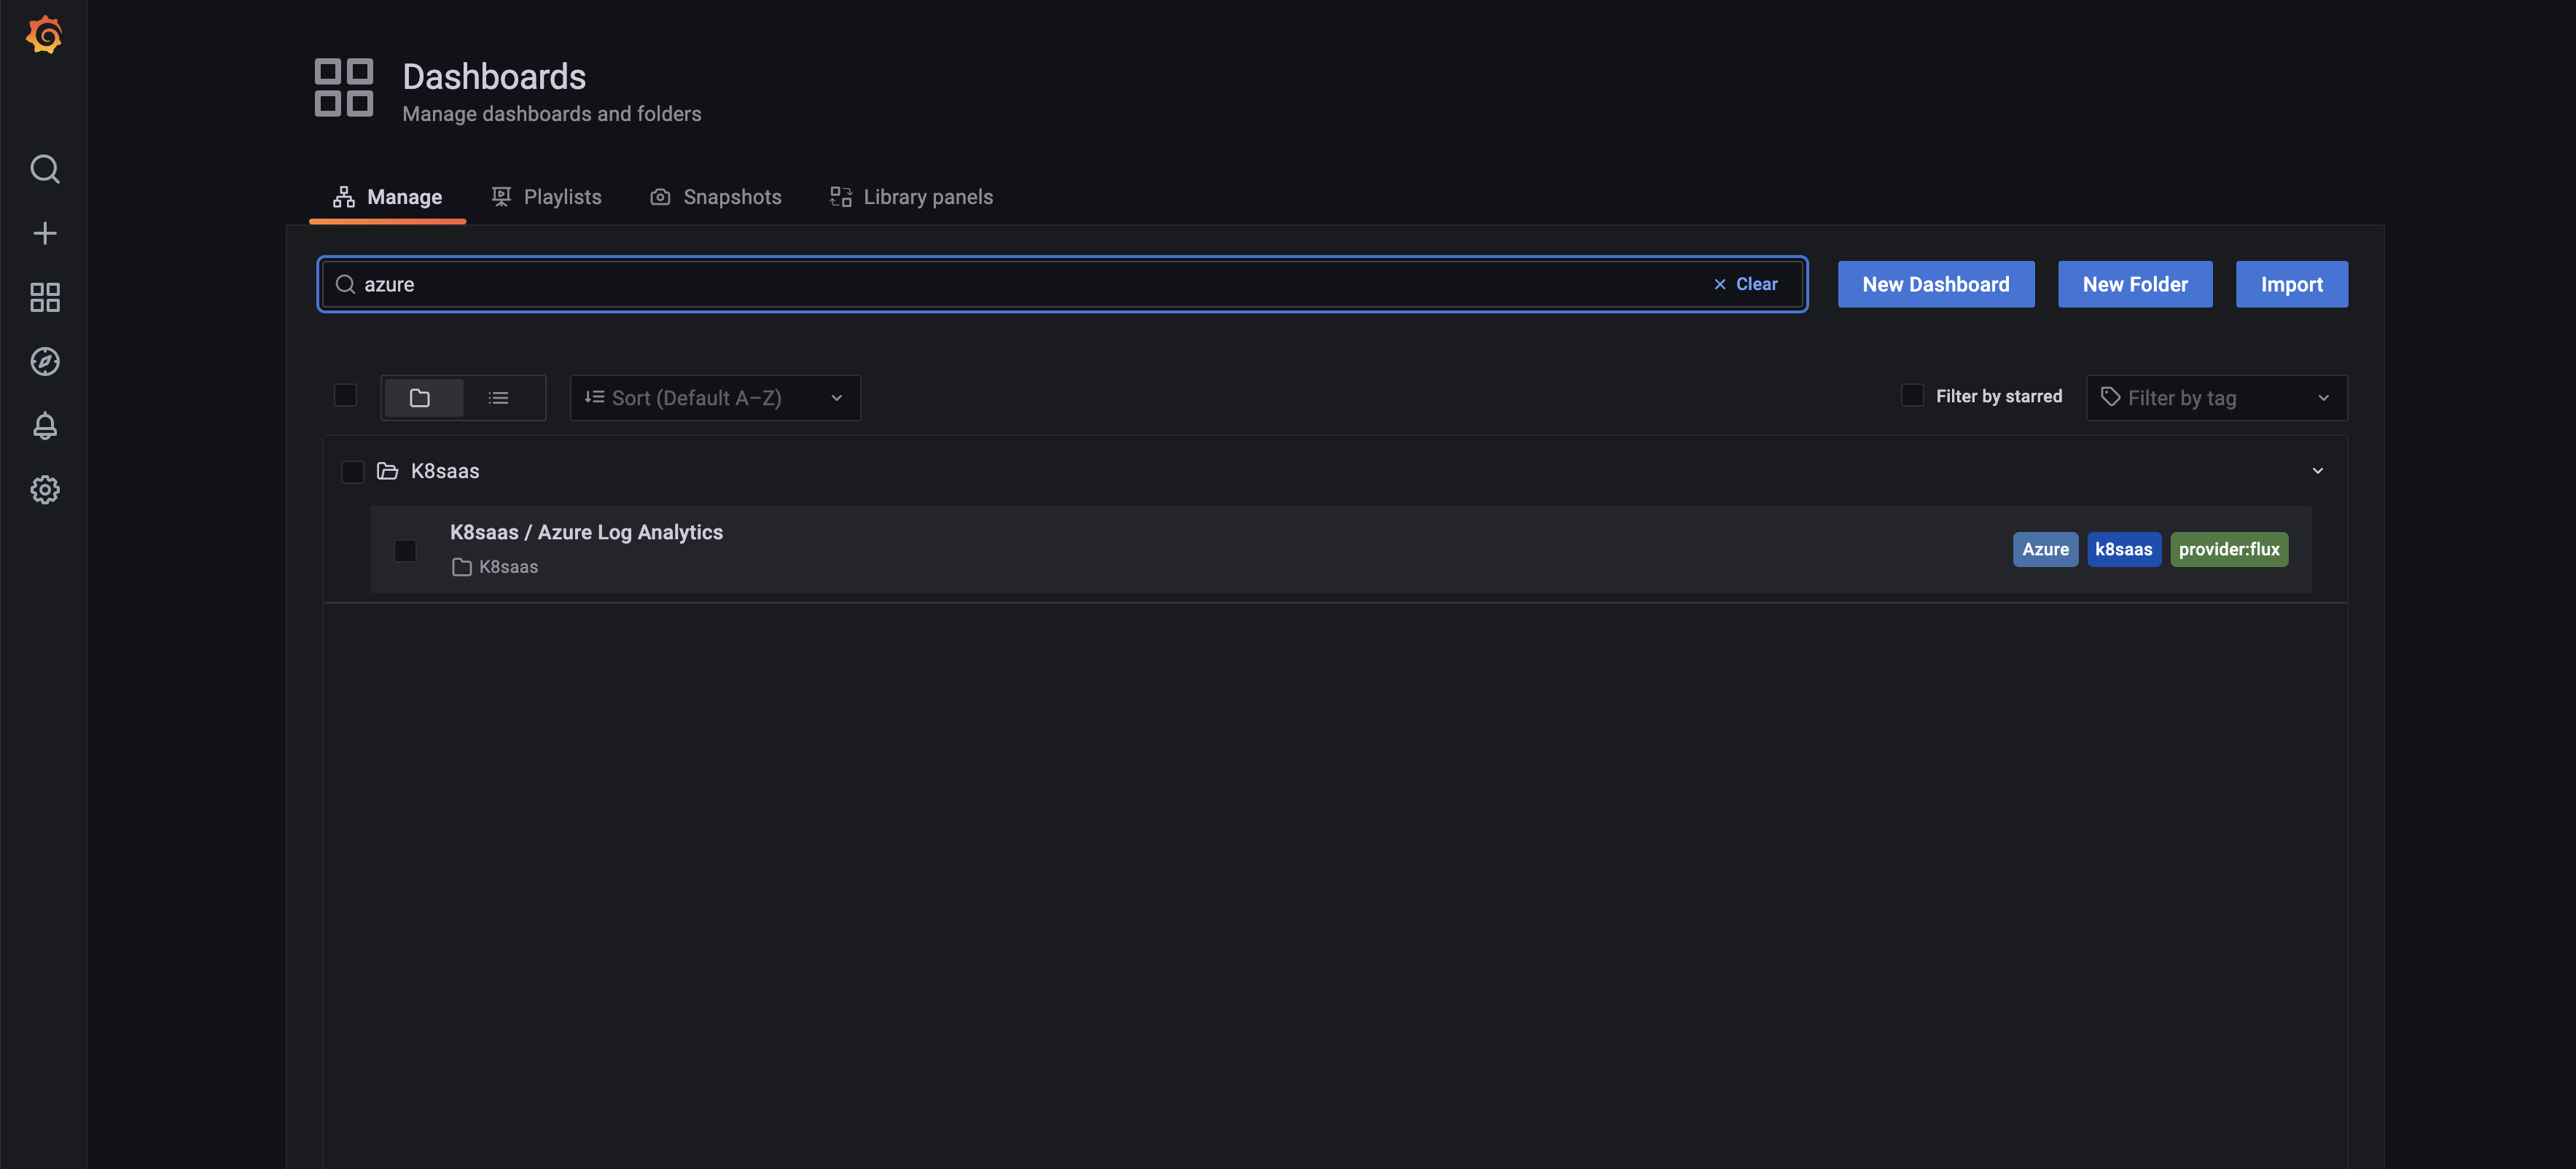
Click on the dashboard.
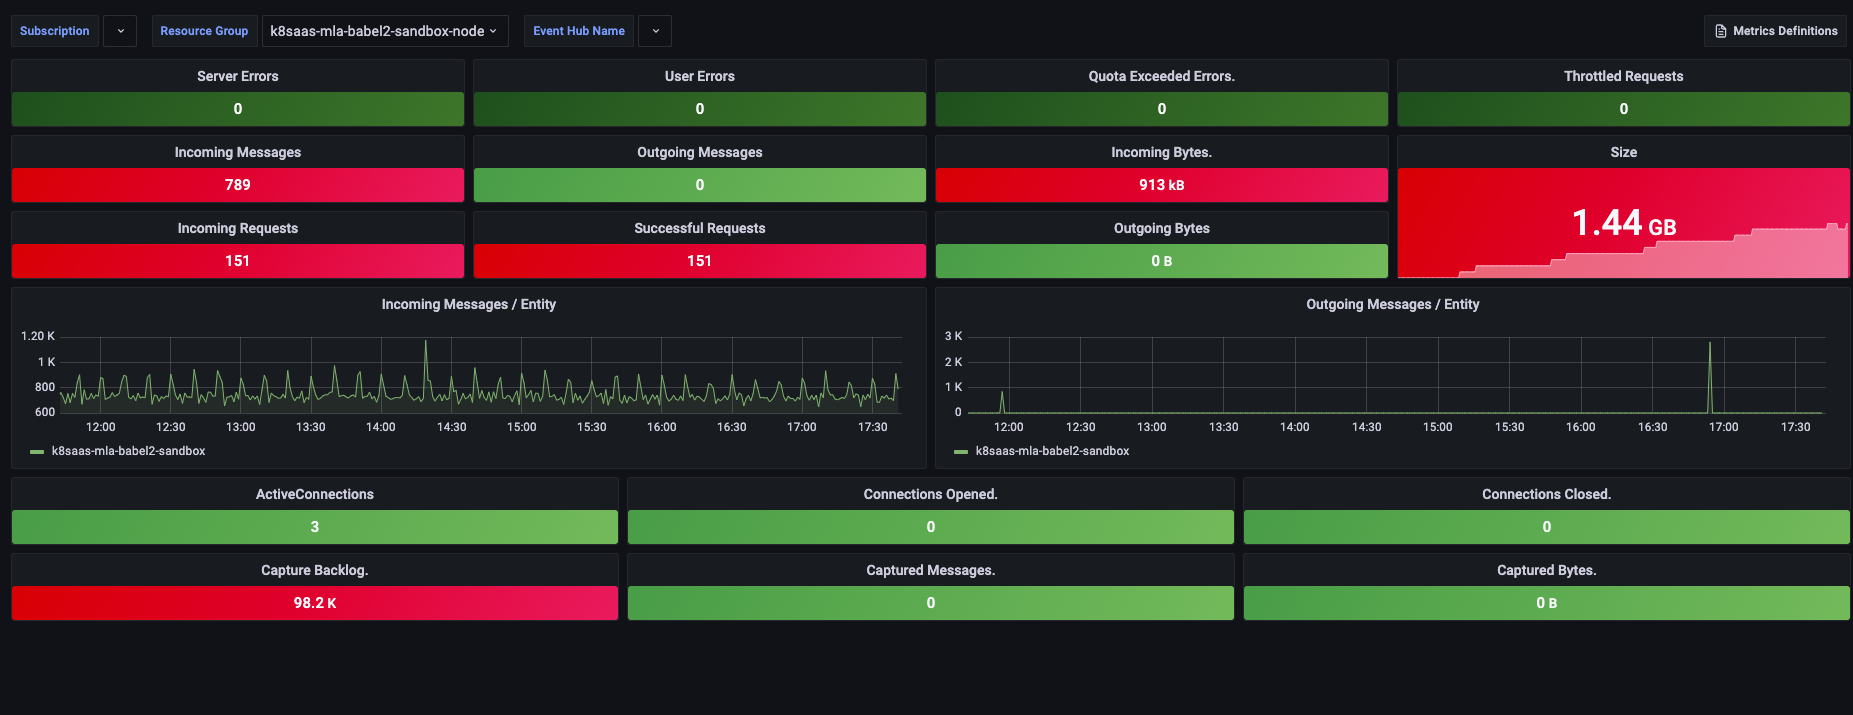
We also provide a dashboard for azure eventhub in case you choose this option to collect your logs.
Go to dashboard tab, and search for eventhub tag. Select the right Resource Group if needed and you should see:
Disable log collection for specific containers
Method A: Self Service
Just add the following annotation to your pods:
annotations:
  fluentbit.io/exclude: "true"
Method B: Hard Coded / Platform service
K8SAAS provides a capability to avoid log collection for a specific pod. By default, k8saas collects logs for all applications.
To do so, go to TrustNest K8SaaS Service catalog with the following information:
- the name your cluster
- the feature you want to enable "disable log collection for specific containers"
- a list of the containers you want to remove from log collection
Note: by default, k8saas removes logs from internal application such as azure-npm and prometheus-operator-grafana containers.
Set a Daily Cap Limit (Explorer)
Microsoft documentation reference.
A daily cap that limit the daily ingestion for your workspace can be configured, however your goal shouldn't be to hit the daily limit. Otherwise, you lose data for the remainder of the day, which can impact other Azure services and solutions whose functionality may depend on up-to-date data being available in the workspace. As a result, your ability to observe and receive alerts when the health conditions of resources supporting IT services are impacted. The daily cap is intended to be used as a way to manage an unexpected increase in data volume from your managed resources and stay within your limit, or when you want to limit unplanned charges for your workspace. It's not appropriate to set a daily cap so that it's met each day on a workspace.
Microsoft controls when the daily cap applied on workspace, each workspace has their own different hour of the day. This reset hour can't be configured.
Soon after the daily limit is reached, the collection of billable data types stops for the rest of the day. Latency inherent in applying the daily cap means that the cap isn't applied at precisely the specified daily cap level. Data collection resumes after the reset time defined under Daily limit will be set at.
To enable the feature:
- Send a ticket with the following information to
support-platform@thalesdigital.io- Activate/Deactivate cap limit
- Daily limit in GB
- Platform team will take care of configuring you daily cap based on your request
Ask for an extraction of archive logs (Preview)
All the applicative logs are kept for 365 days. Even if you can't access to those logs using the azure portal or azure log analytics, we can provide you an archive with all the collected logs.
To do so, please raise a ticket to support-platform@thalesdigital.io with the following info:
- ask escalade the ticket to tdp-k8saas
- which type of logs you want (choices: app, ingress, waf, ingress)
- precise the period
Note: We recommend asking the Trustnest blue team to perform directly the investigation for you, because they already have access to these logs.