Cluster Monitoring with Grafana
Context
K8SaaS provides a dashboarding capability to look at the cluster metrics as well as your applicative metrics.

Several types of metrics are collected:
- system metrics
- kubernetes metrics
- application metrics
Use case
- Monitor an SLA, a capacity planning
- Post-mortem diagnosis
- Real-time monitoring & dashboarding
Access to the Monitoring Portal
First, get the following information:
- K8SAAS_SUBSCRIPTION_ID
- K8SAAS_INSTANCE_NAME
- Standard
- With Corporate Addon
- Legacy
Then, access to the URLS: https://grafana.K8SAAS_INSTANCE_NAME_WITHOUT_k8saas.region.k8saas.thalesdigital.io/
For instance: https://grafana.lja-sandbox.eu.k8saas.thalesdigital.io rather than https://grafana.k8saas-lja-sandbox.kaas.thalesdigital.io
Then, access to the URLS: https://grafana.K8SAAS_INSTANCE_NAME_WITHOUT_k8saas.ahe.tdp.infra.thales/
Then, access to the URLS: https://grafana.K8SAAS_INSTANCE_NAME.kaas.thalesdigital.io/
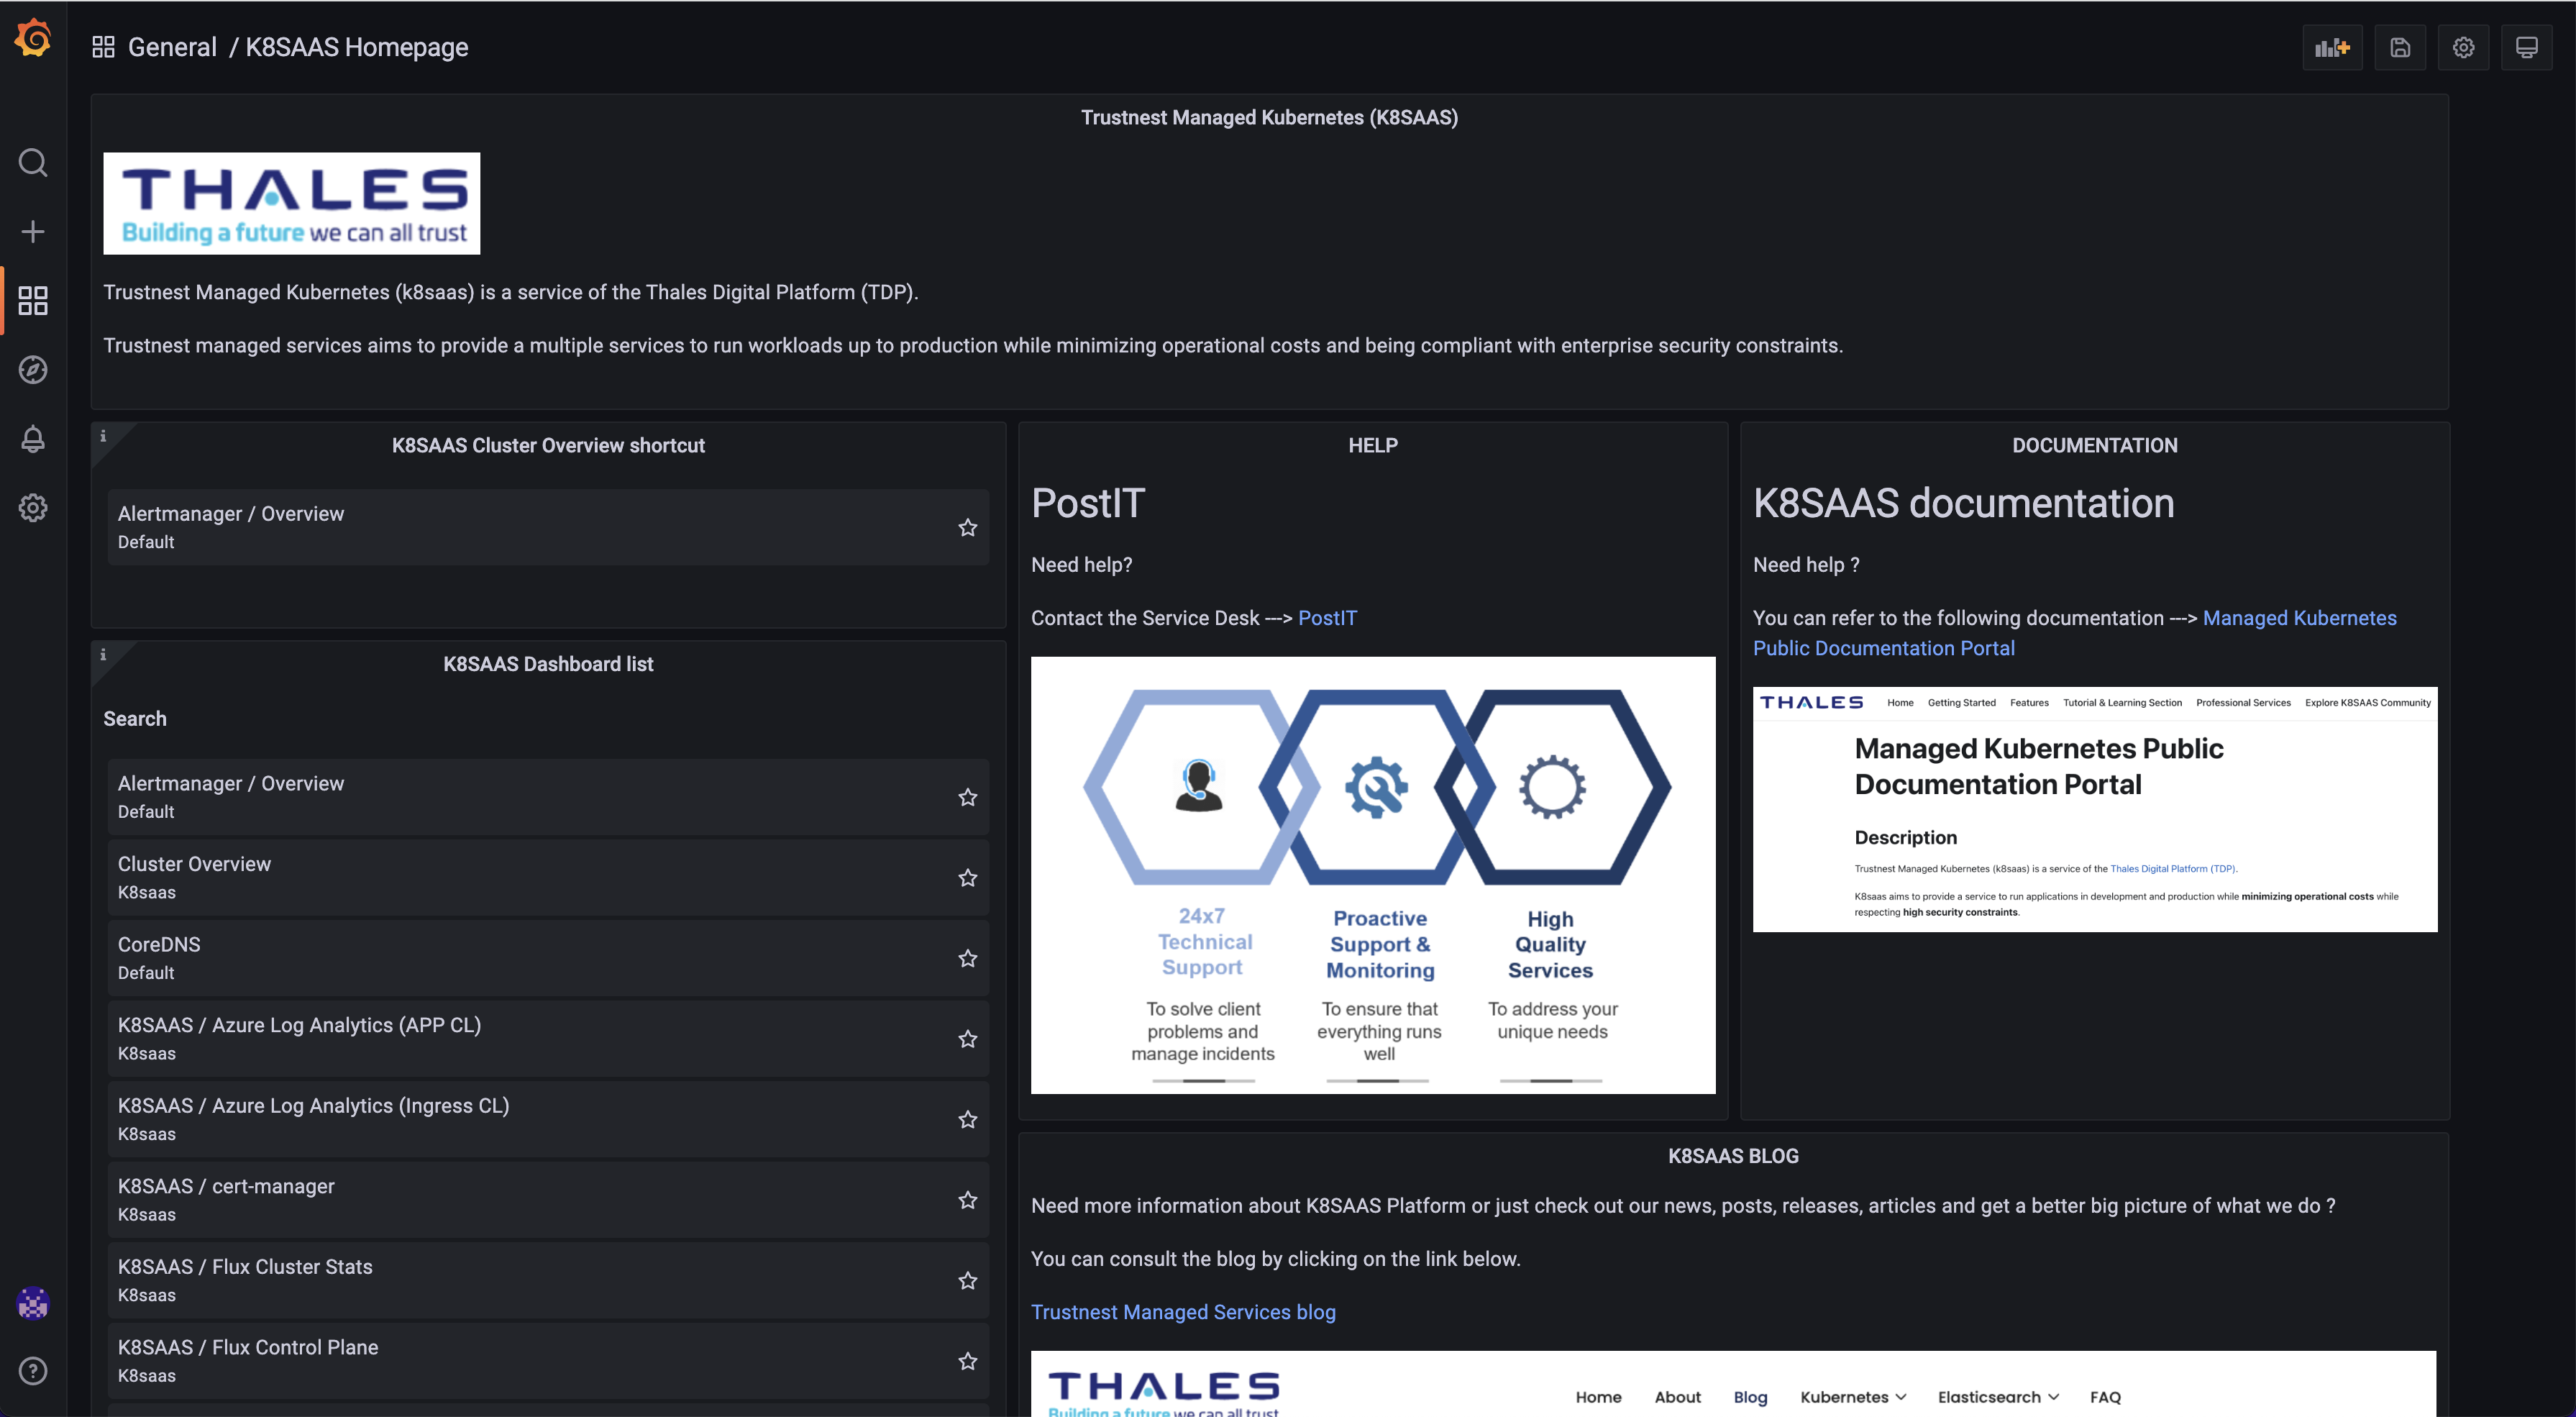
On this dashboard, you have all the common links to access to blog, online documentation or k8saas custom dashboards.
Here are the default dashboards imported:
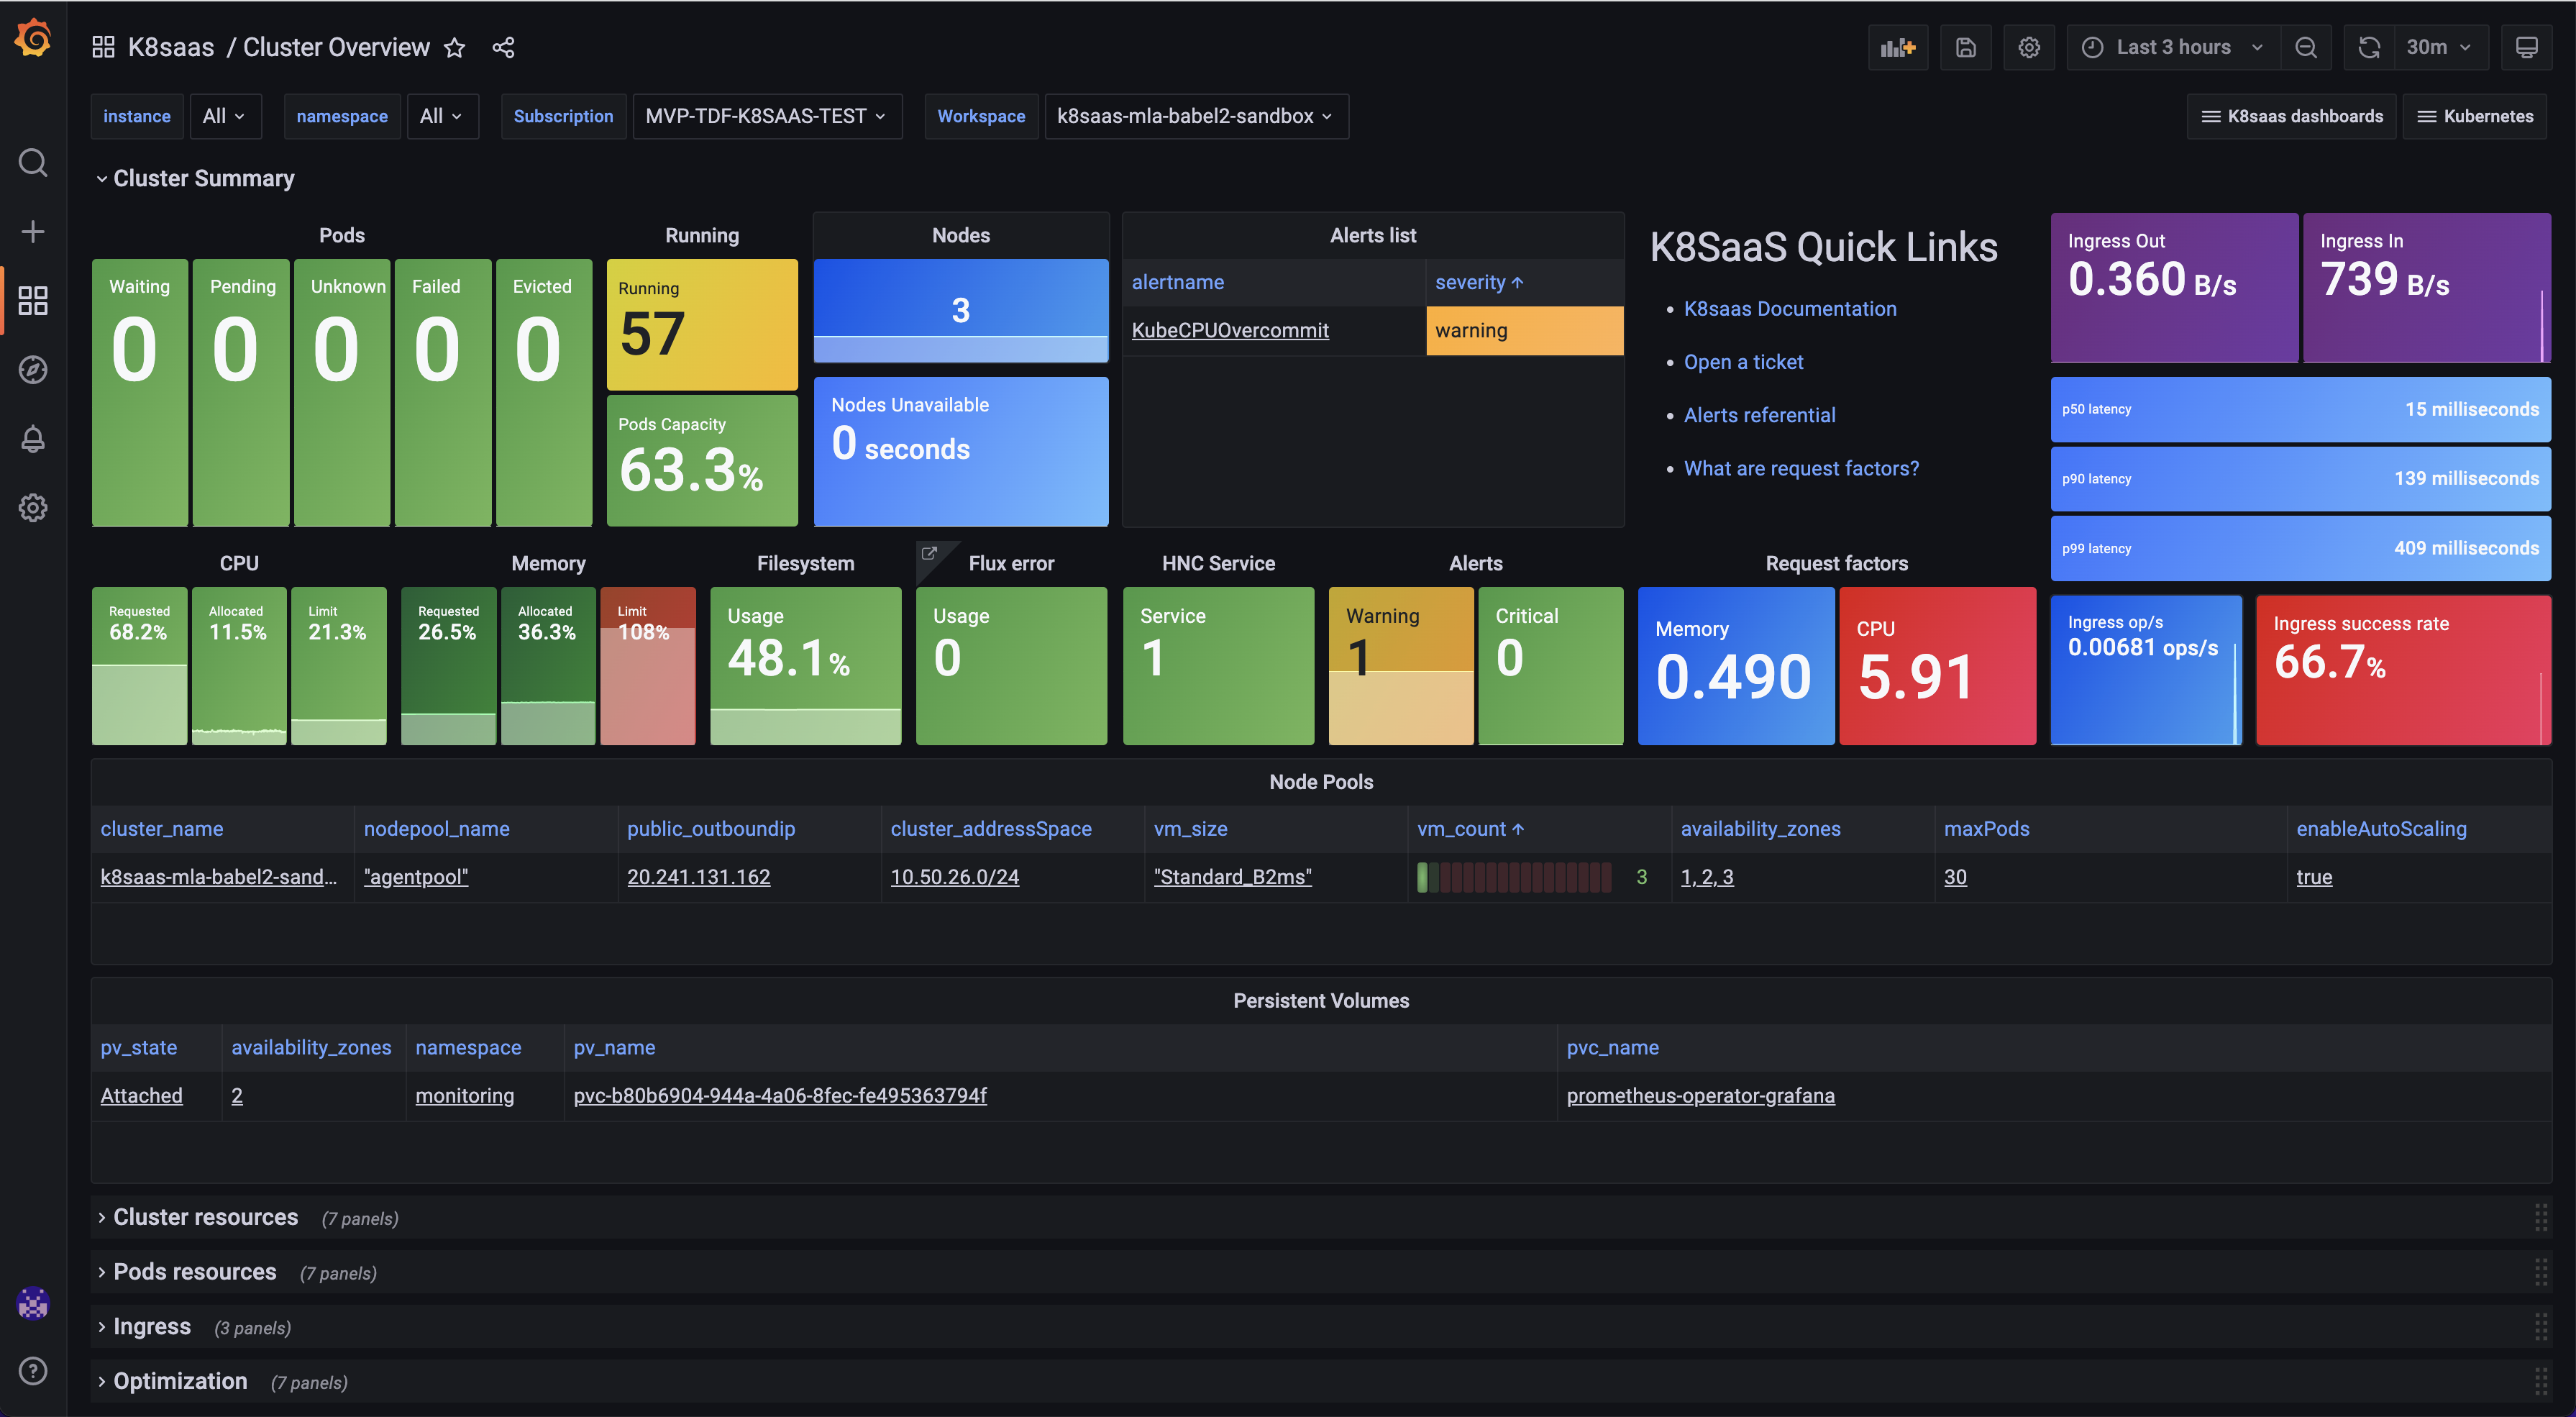
Overview
Goal: Get the status of the cluster and discover the cloud resources used by AKS
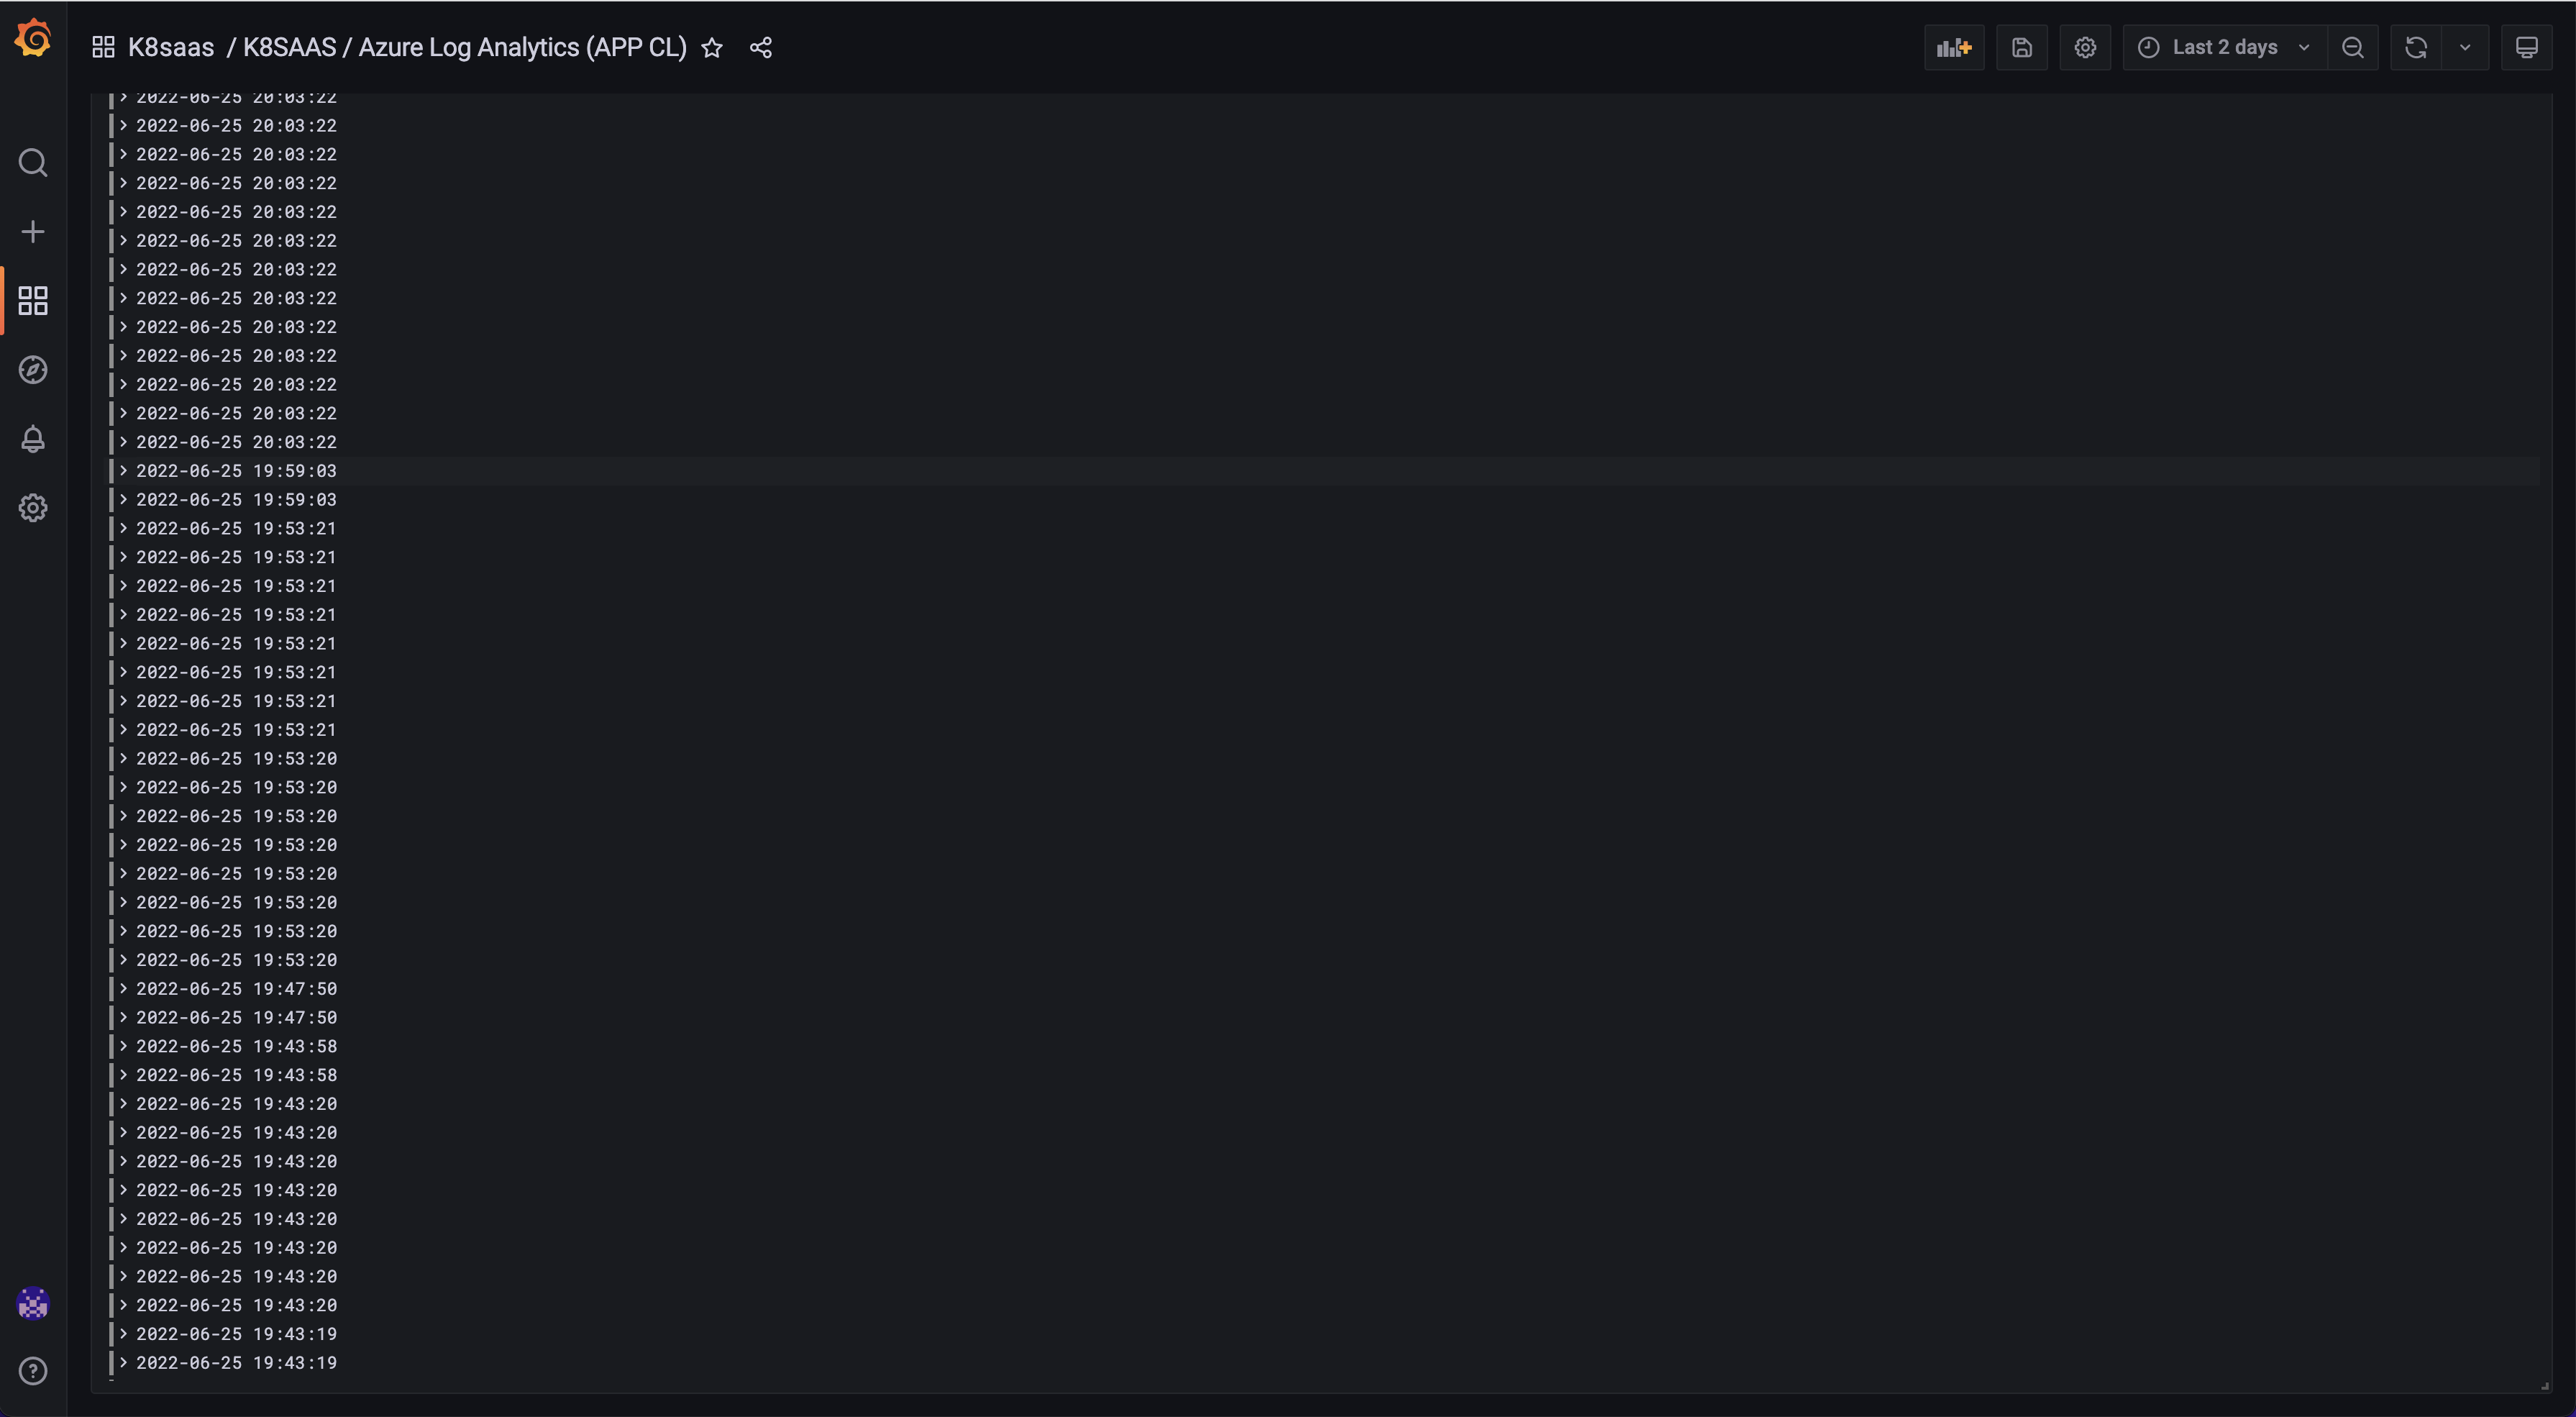
Azure Log Analytics (app CL)
Azure Log Analytics (app CL) and Azure Log Analytics (ingress CL) were merged together and named Azure Log Analytics.
Goal: Select your own namespace and look at the stdout and stderr logs of your applications
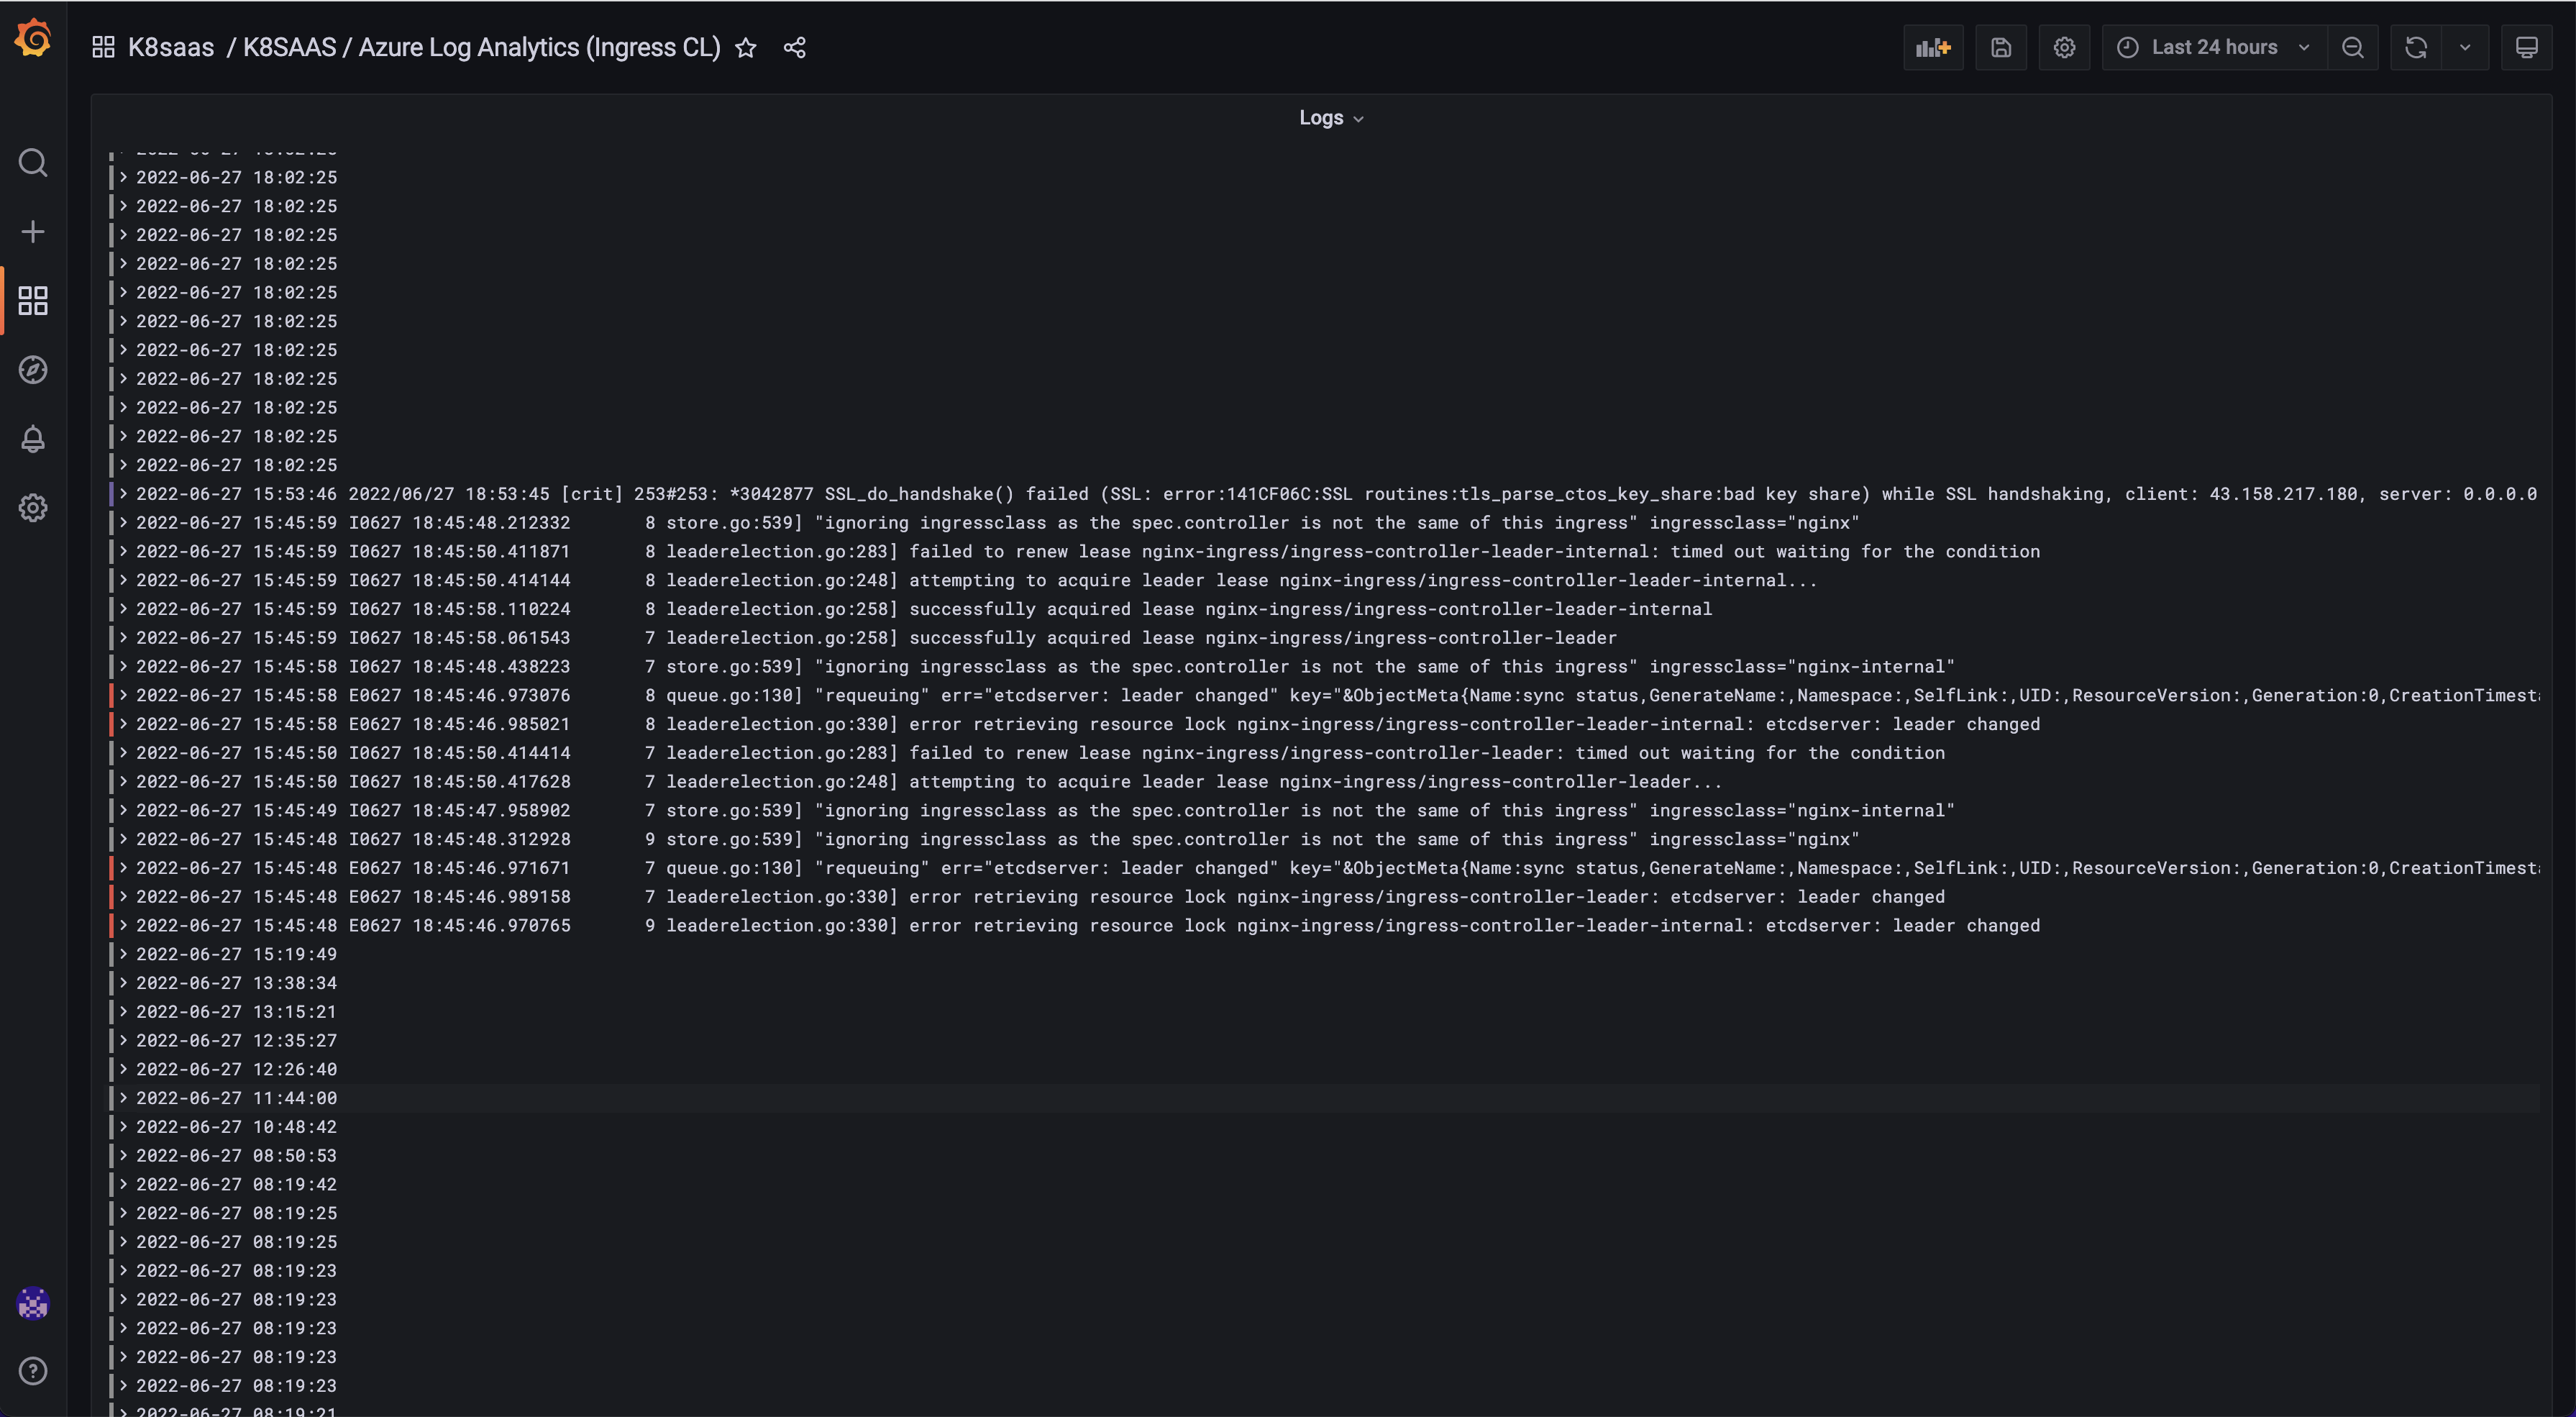
Azure Log Analytics (ingress CL)
Azure Log Analytics (app CL) and Azure Log Analytics (ingress CL) were merged together and named Azure Log Analytics.
Goal: Look at NGINX ingress controller logs
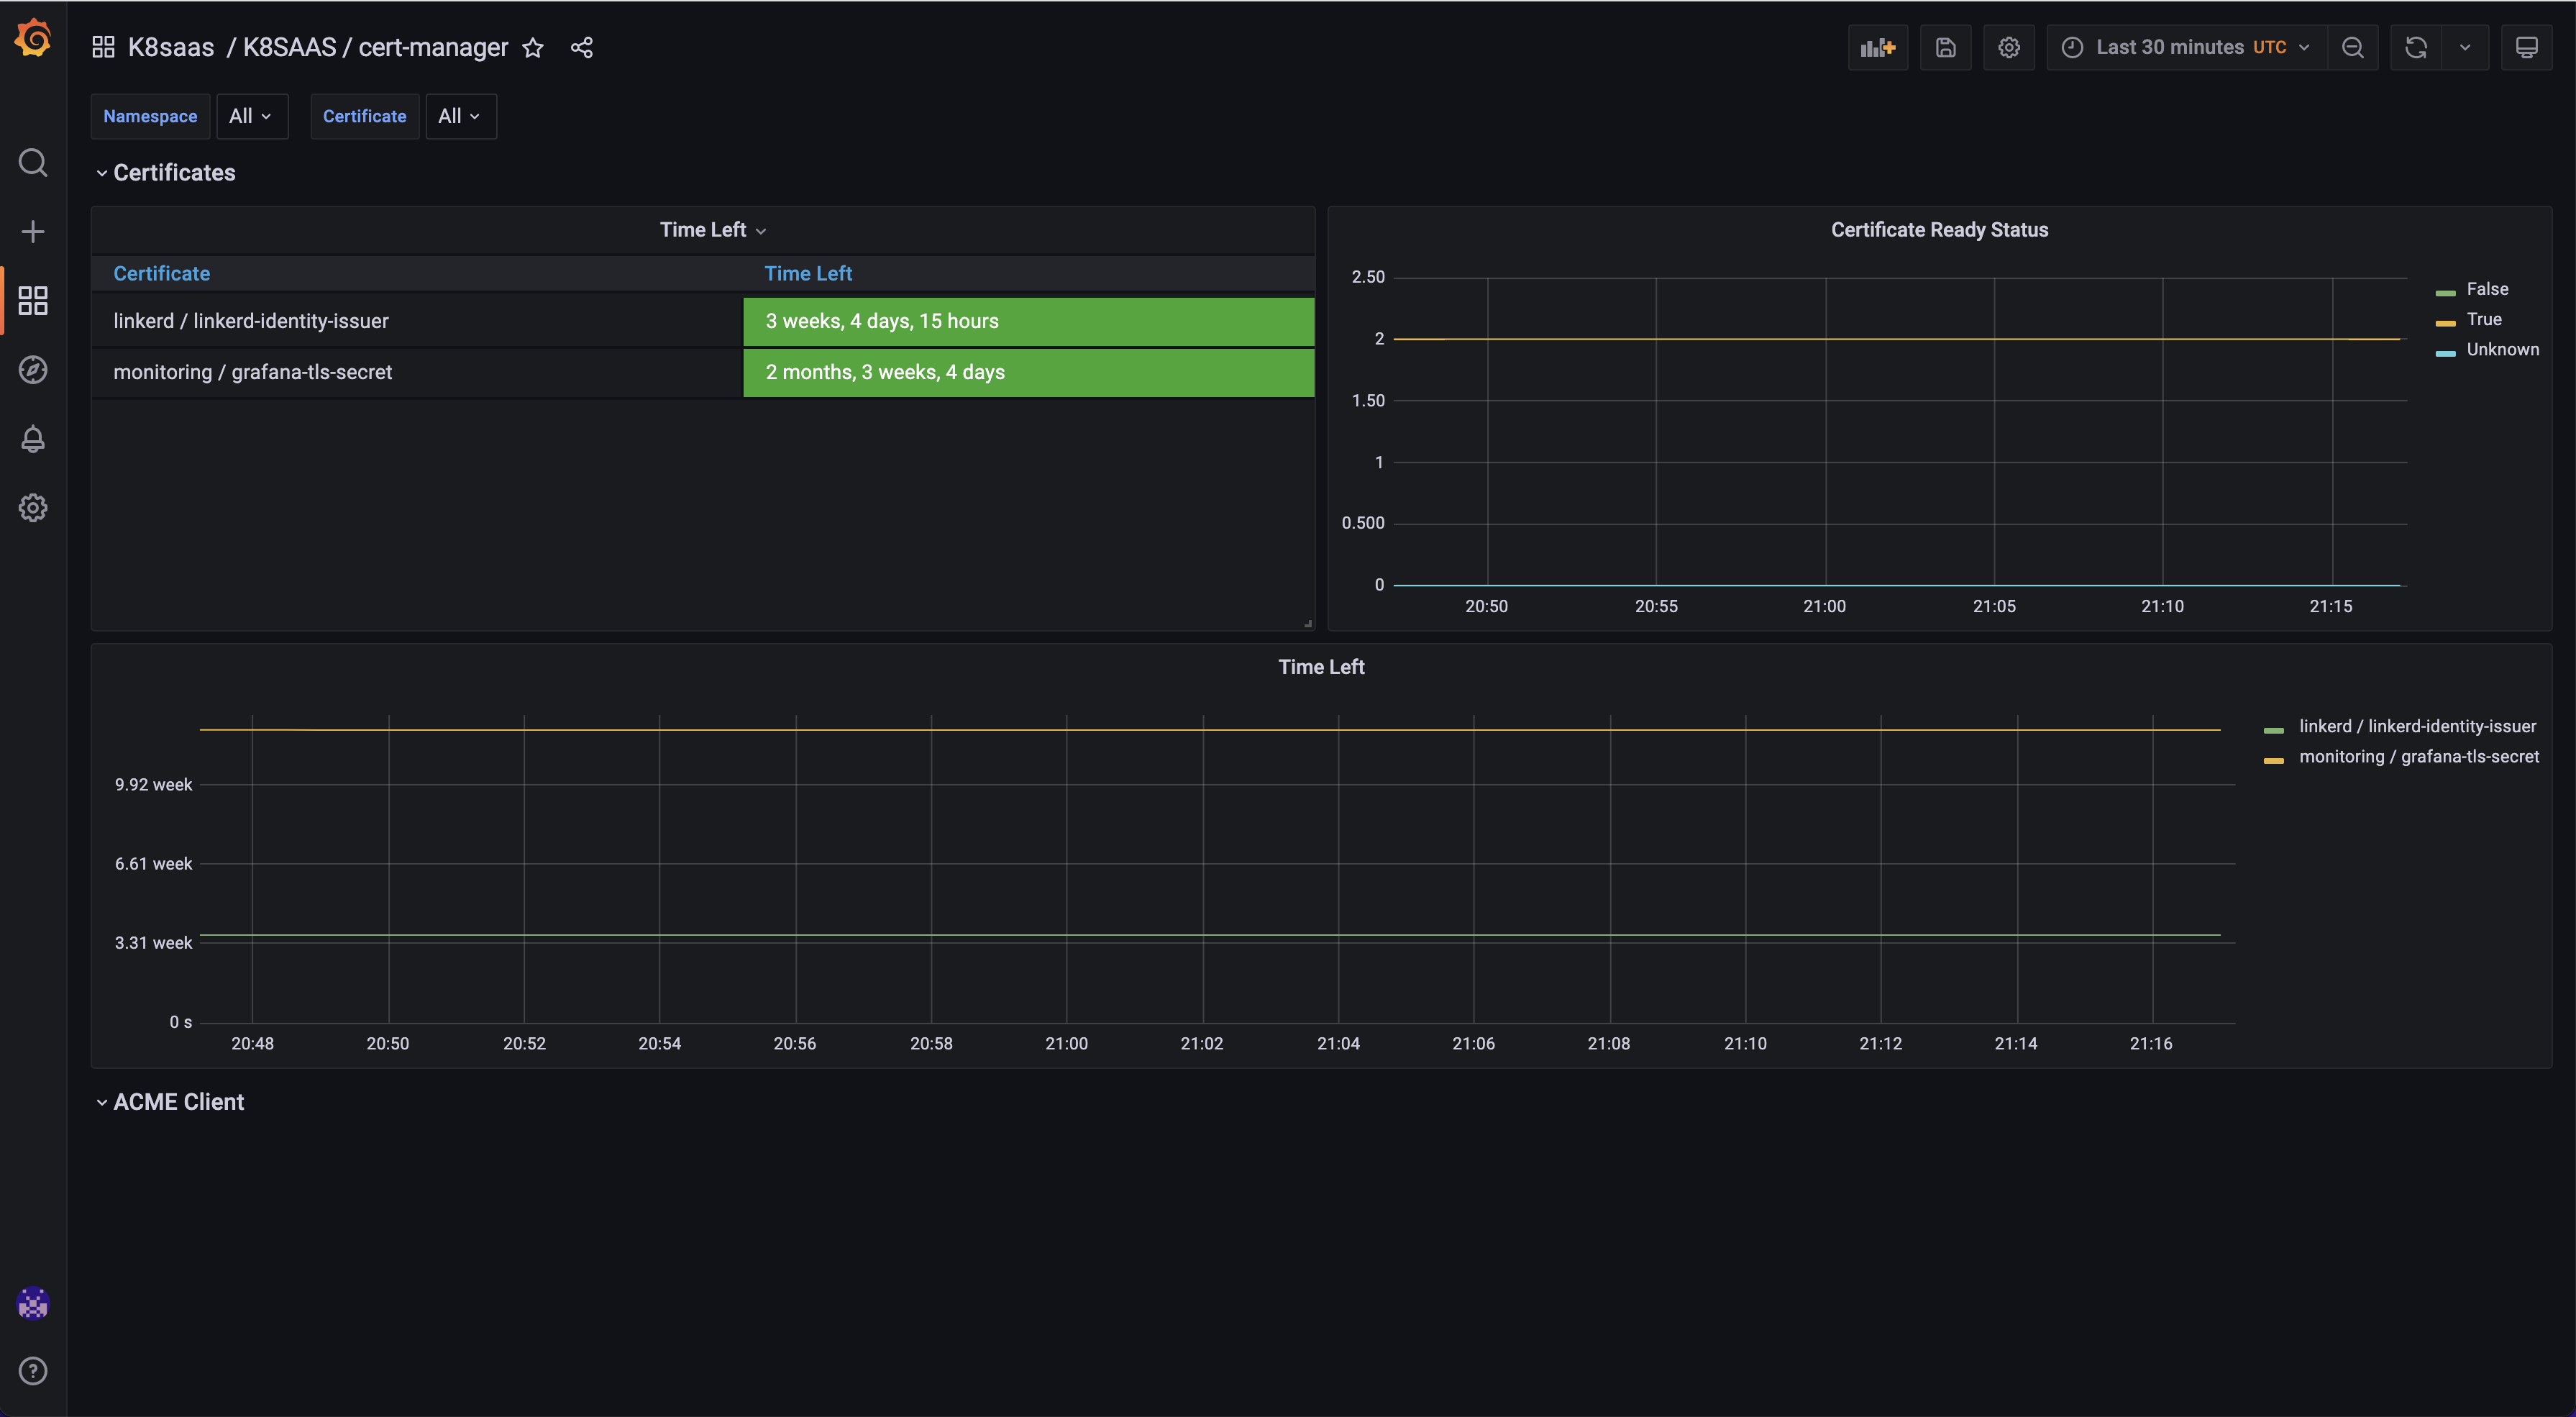
Cert Manager
Goal: Monitor your certificates
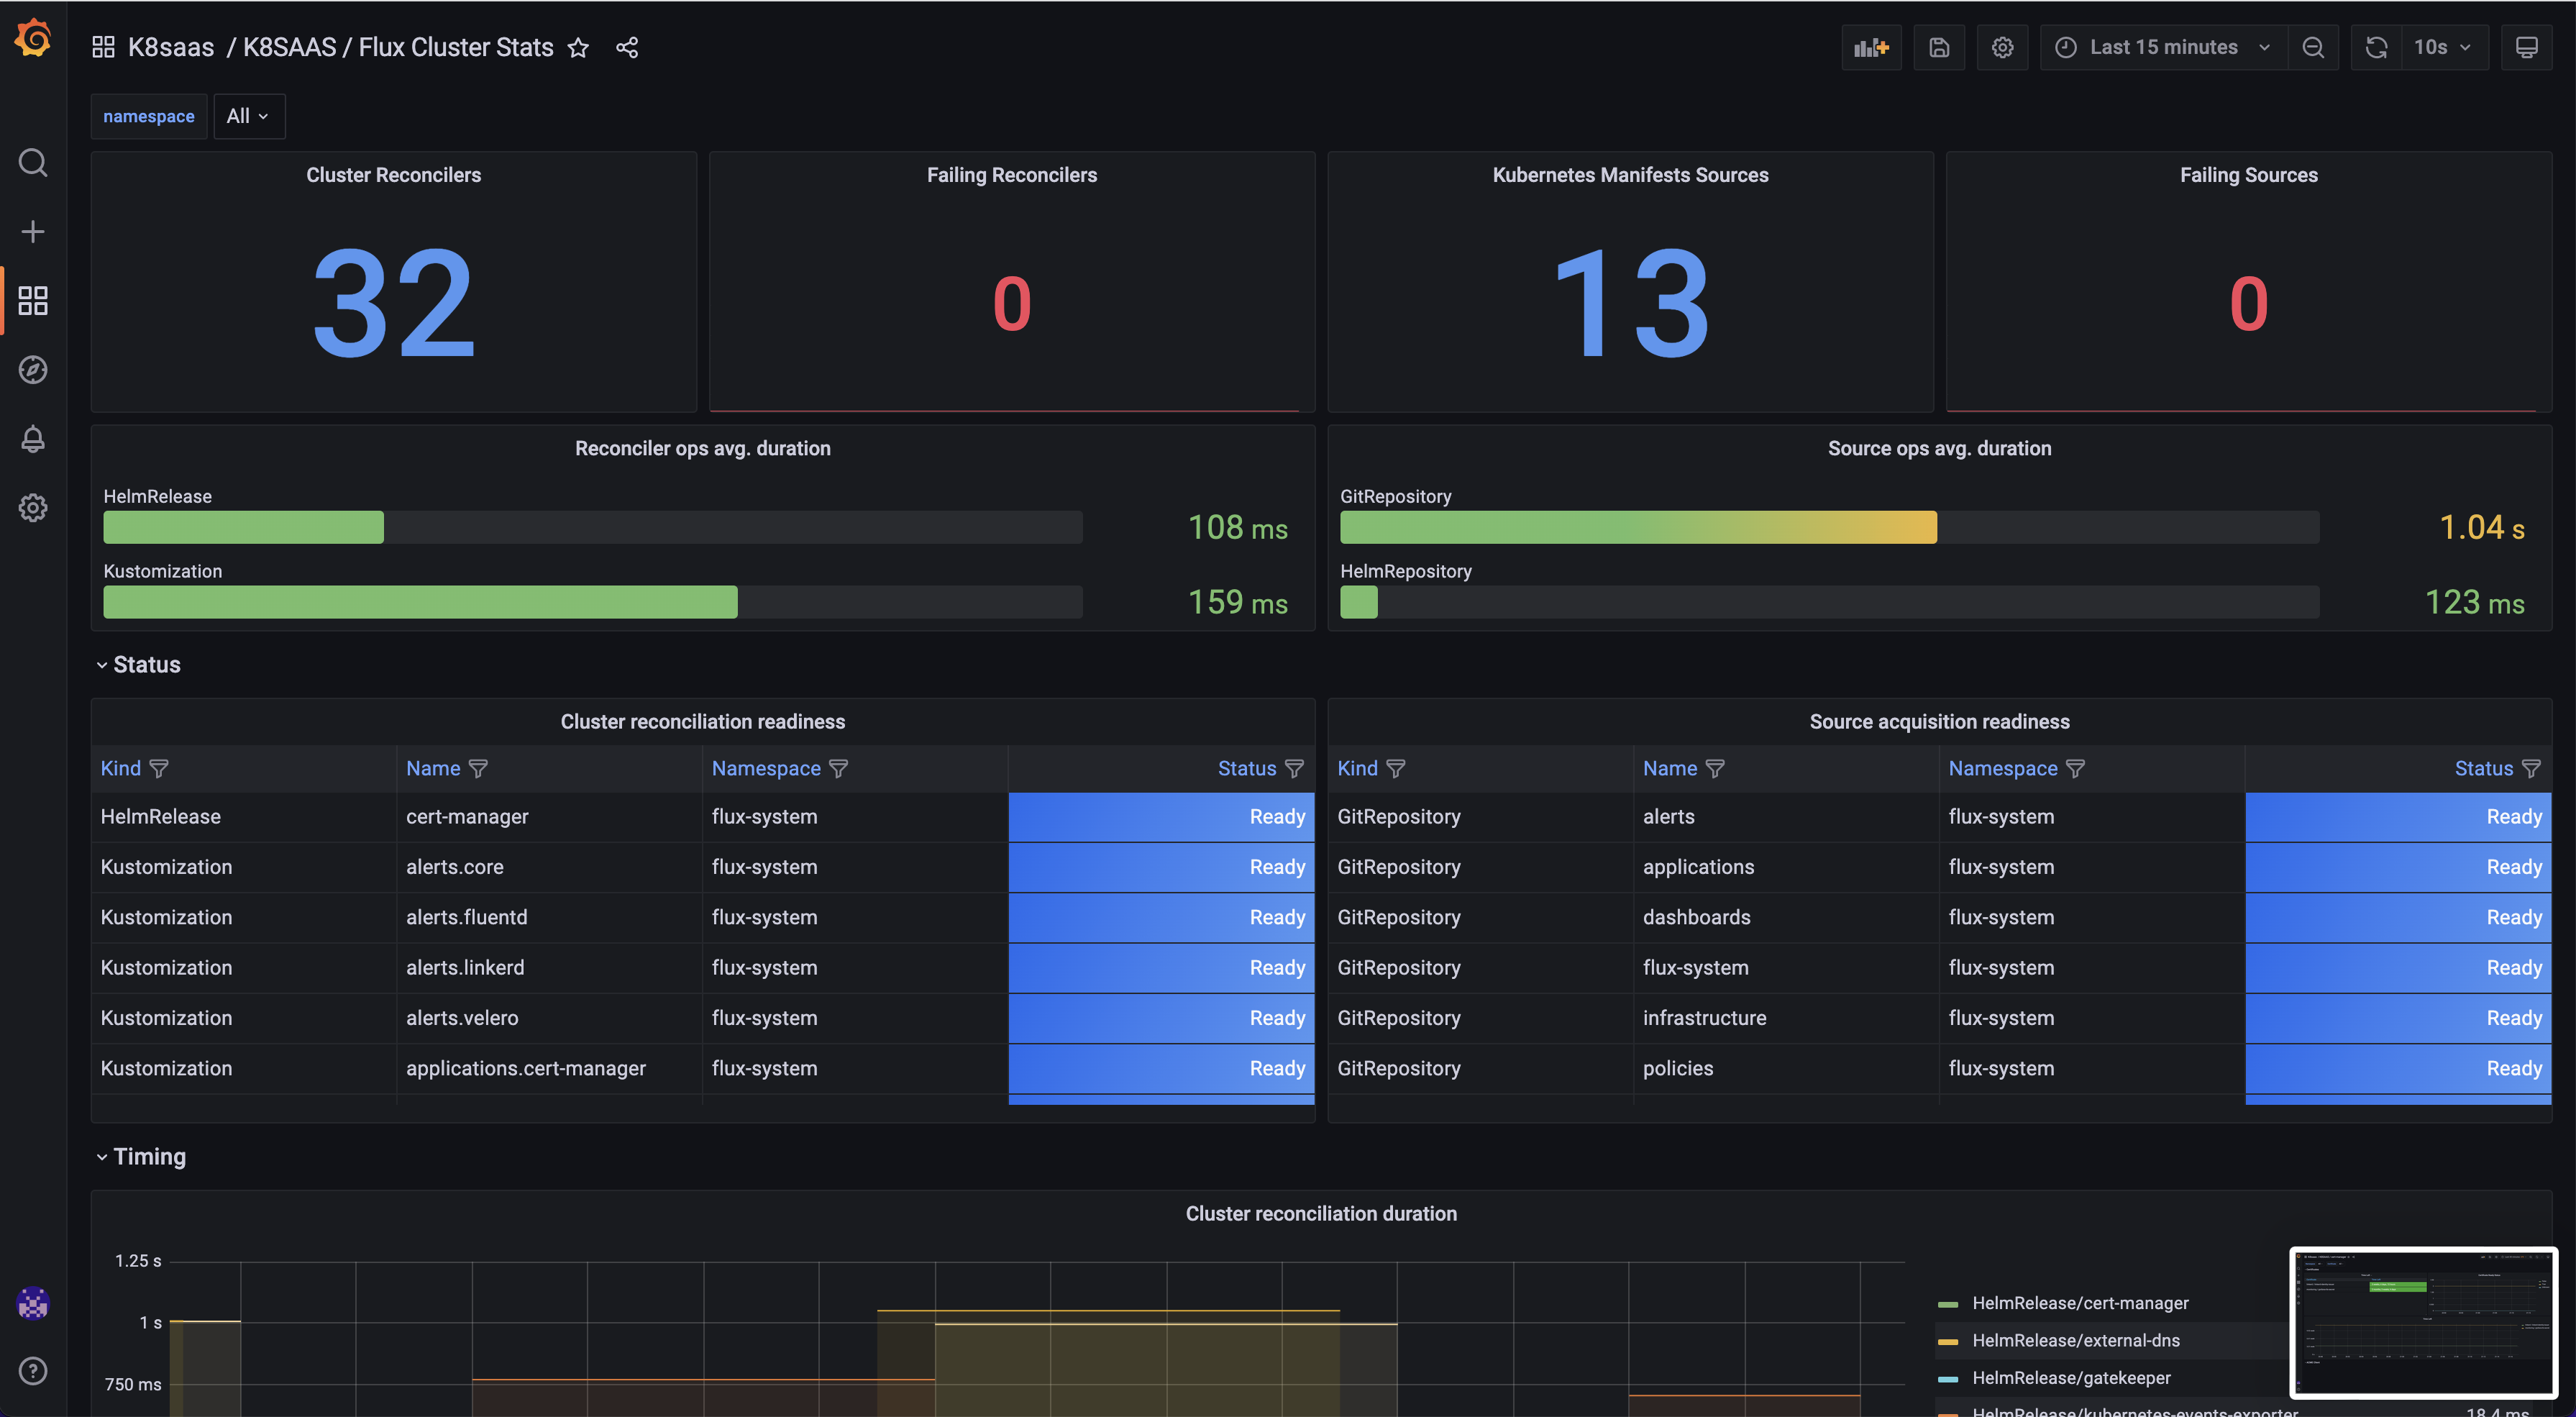
Flux Cluster stats
Goal: Monitor the k8saas transversal application deployed by default
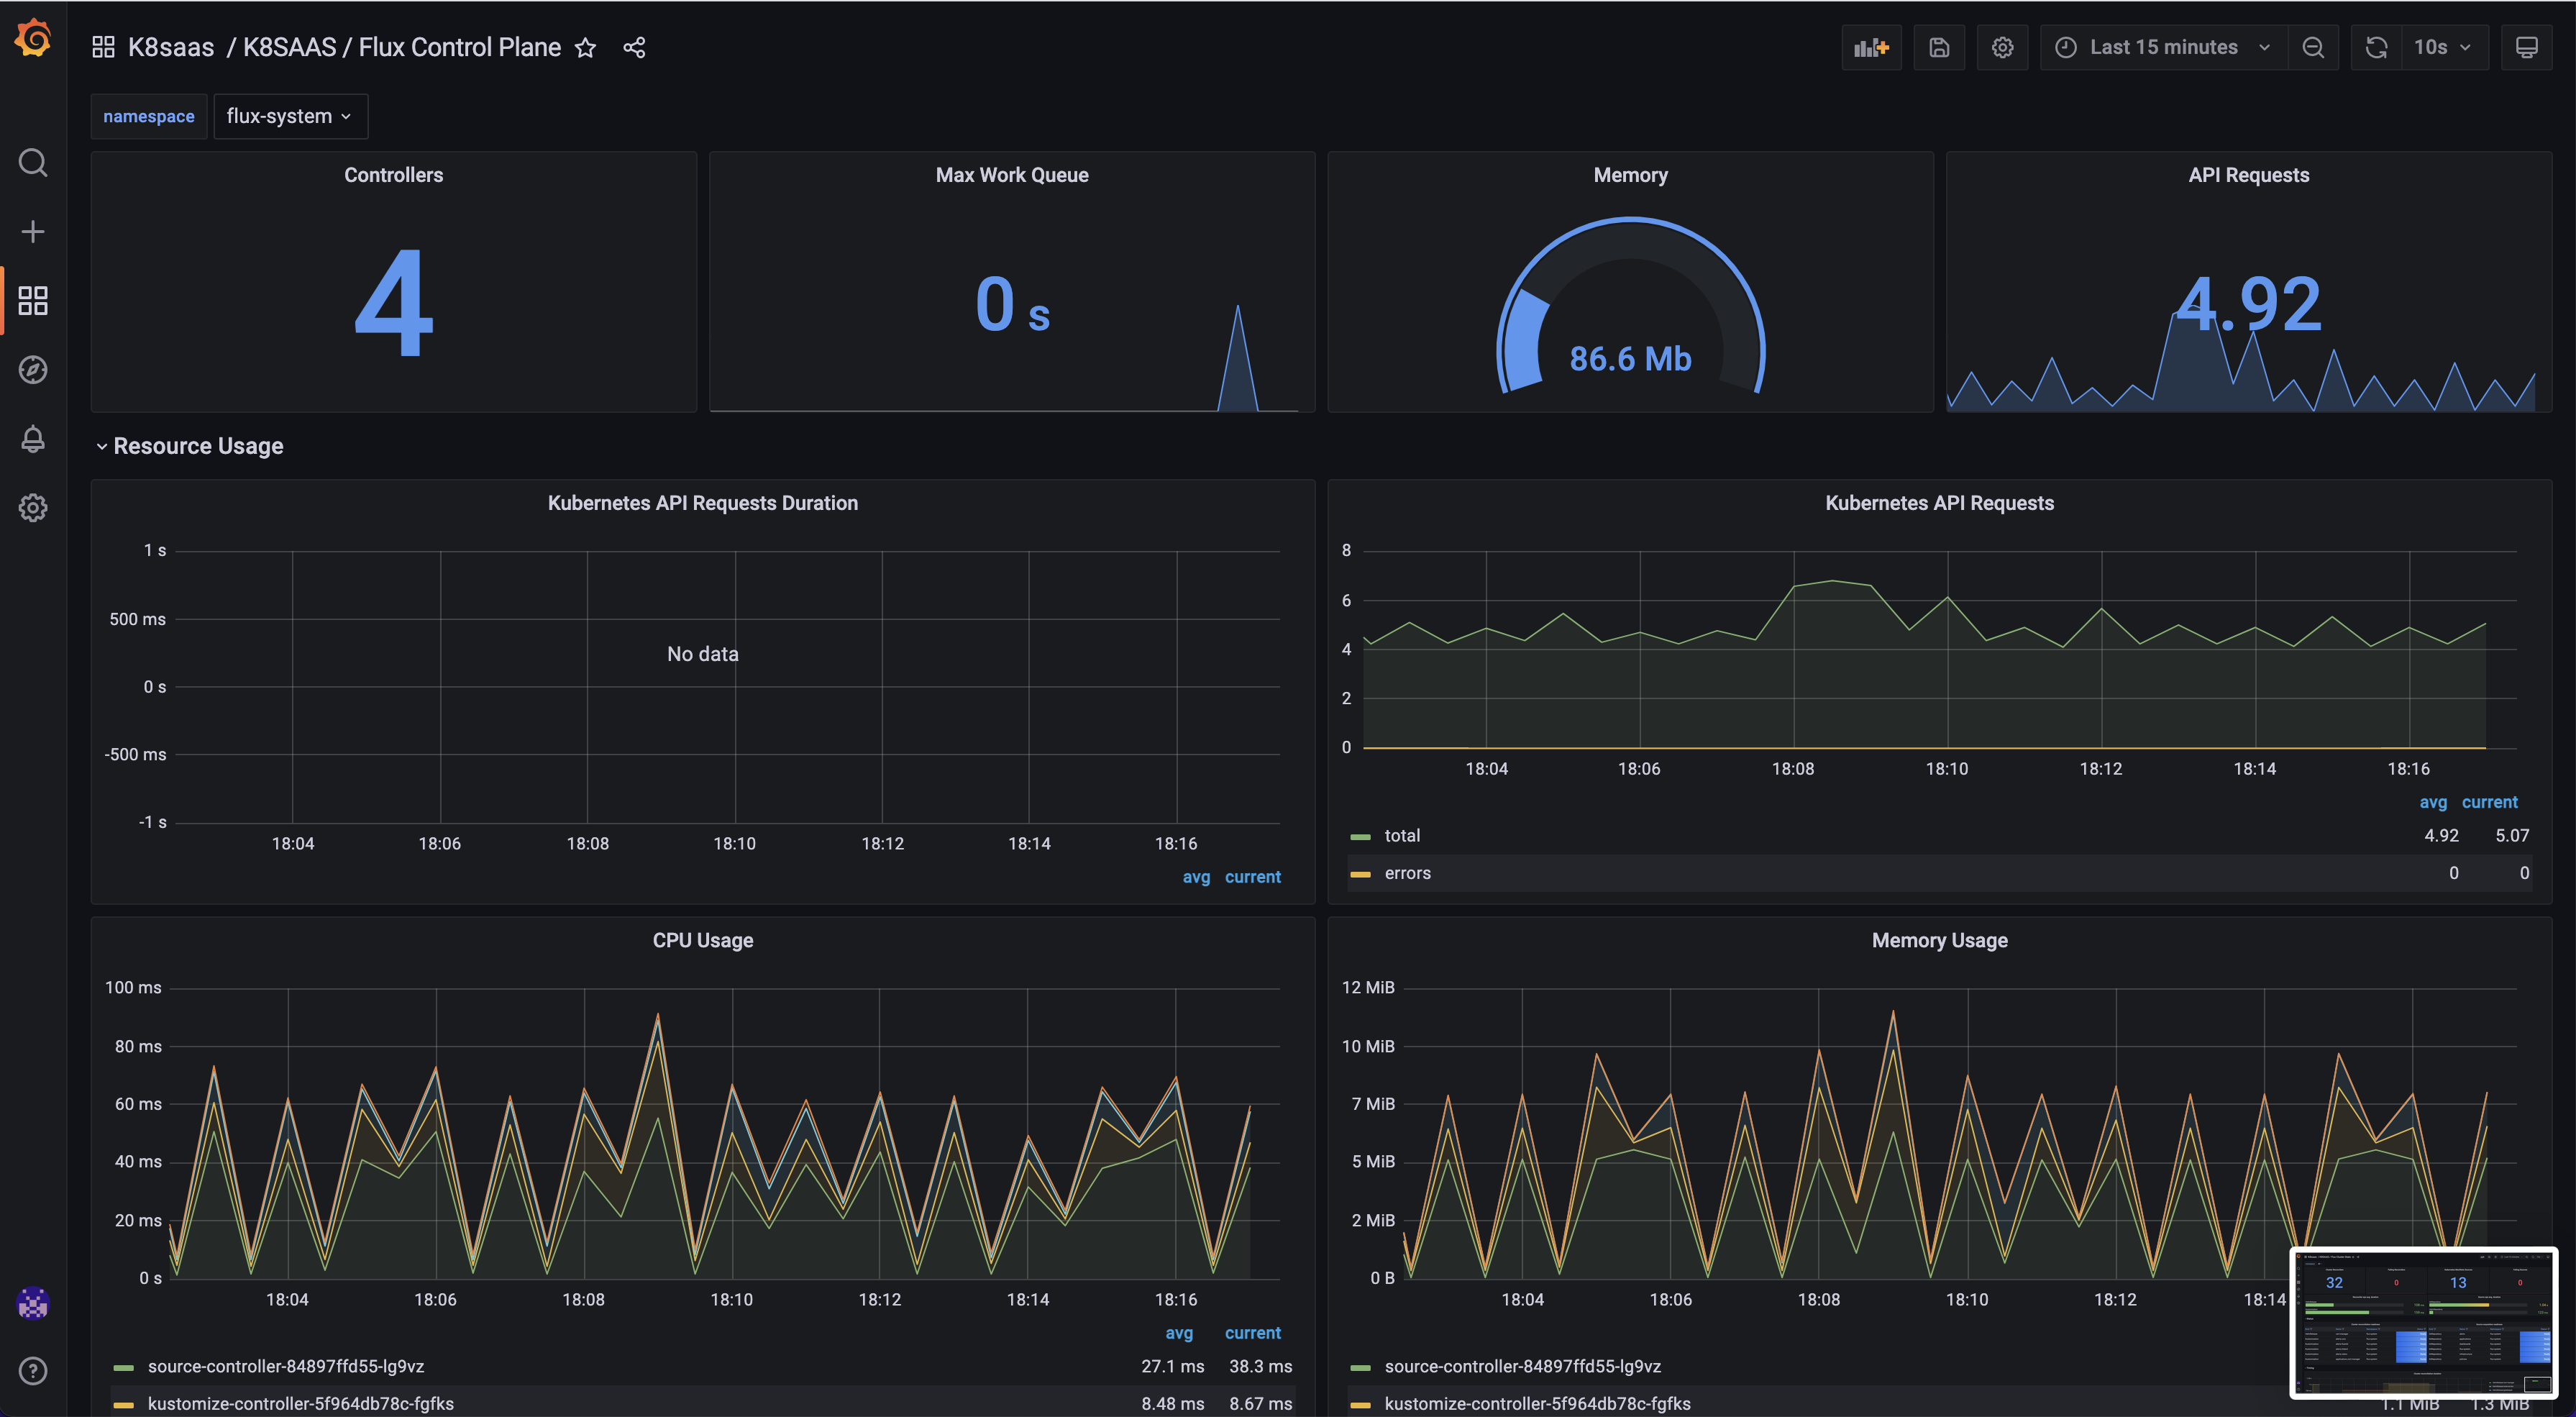
Flux Control plane
Goal: Monitor flux controllers
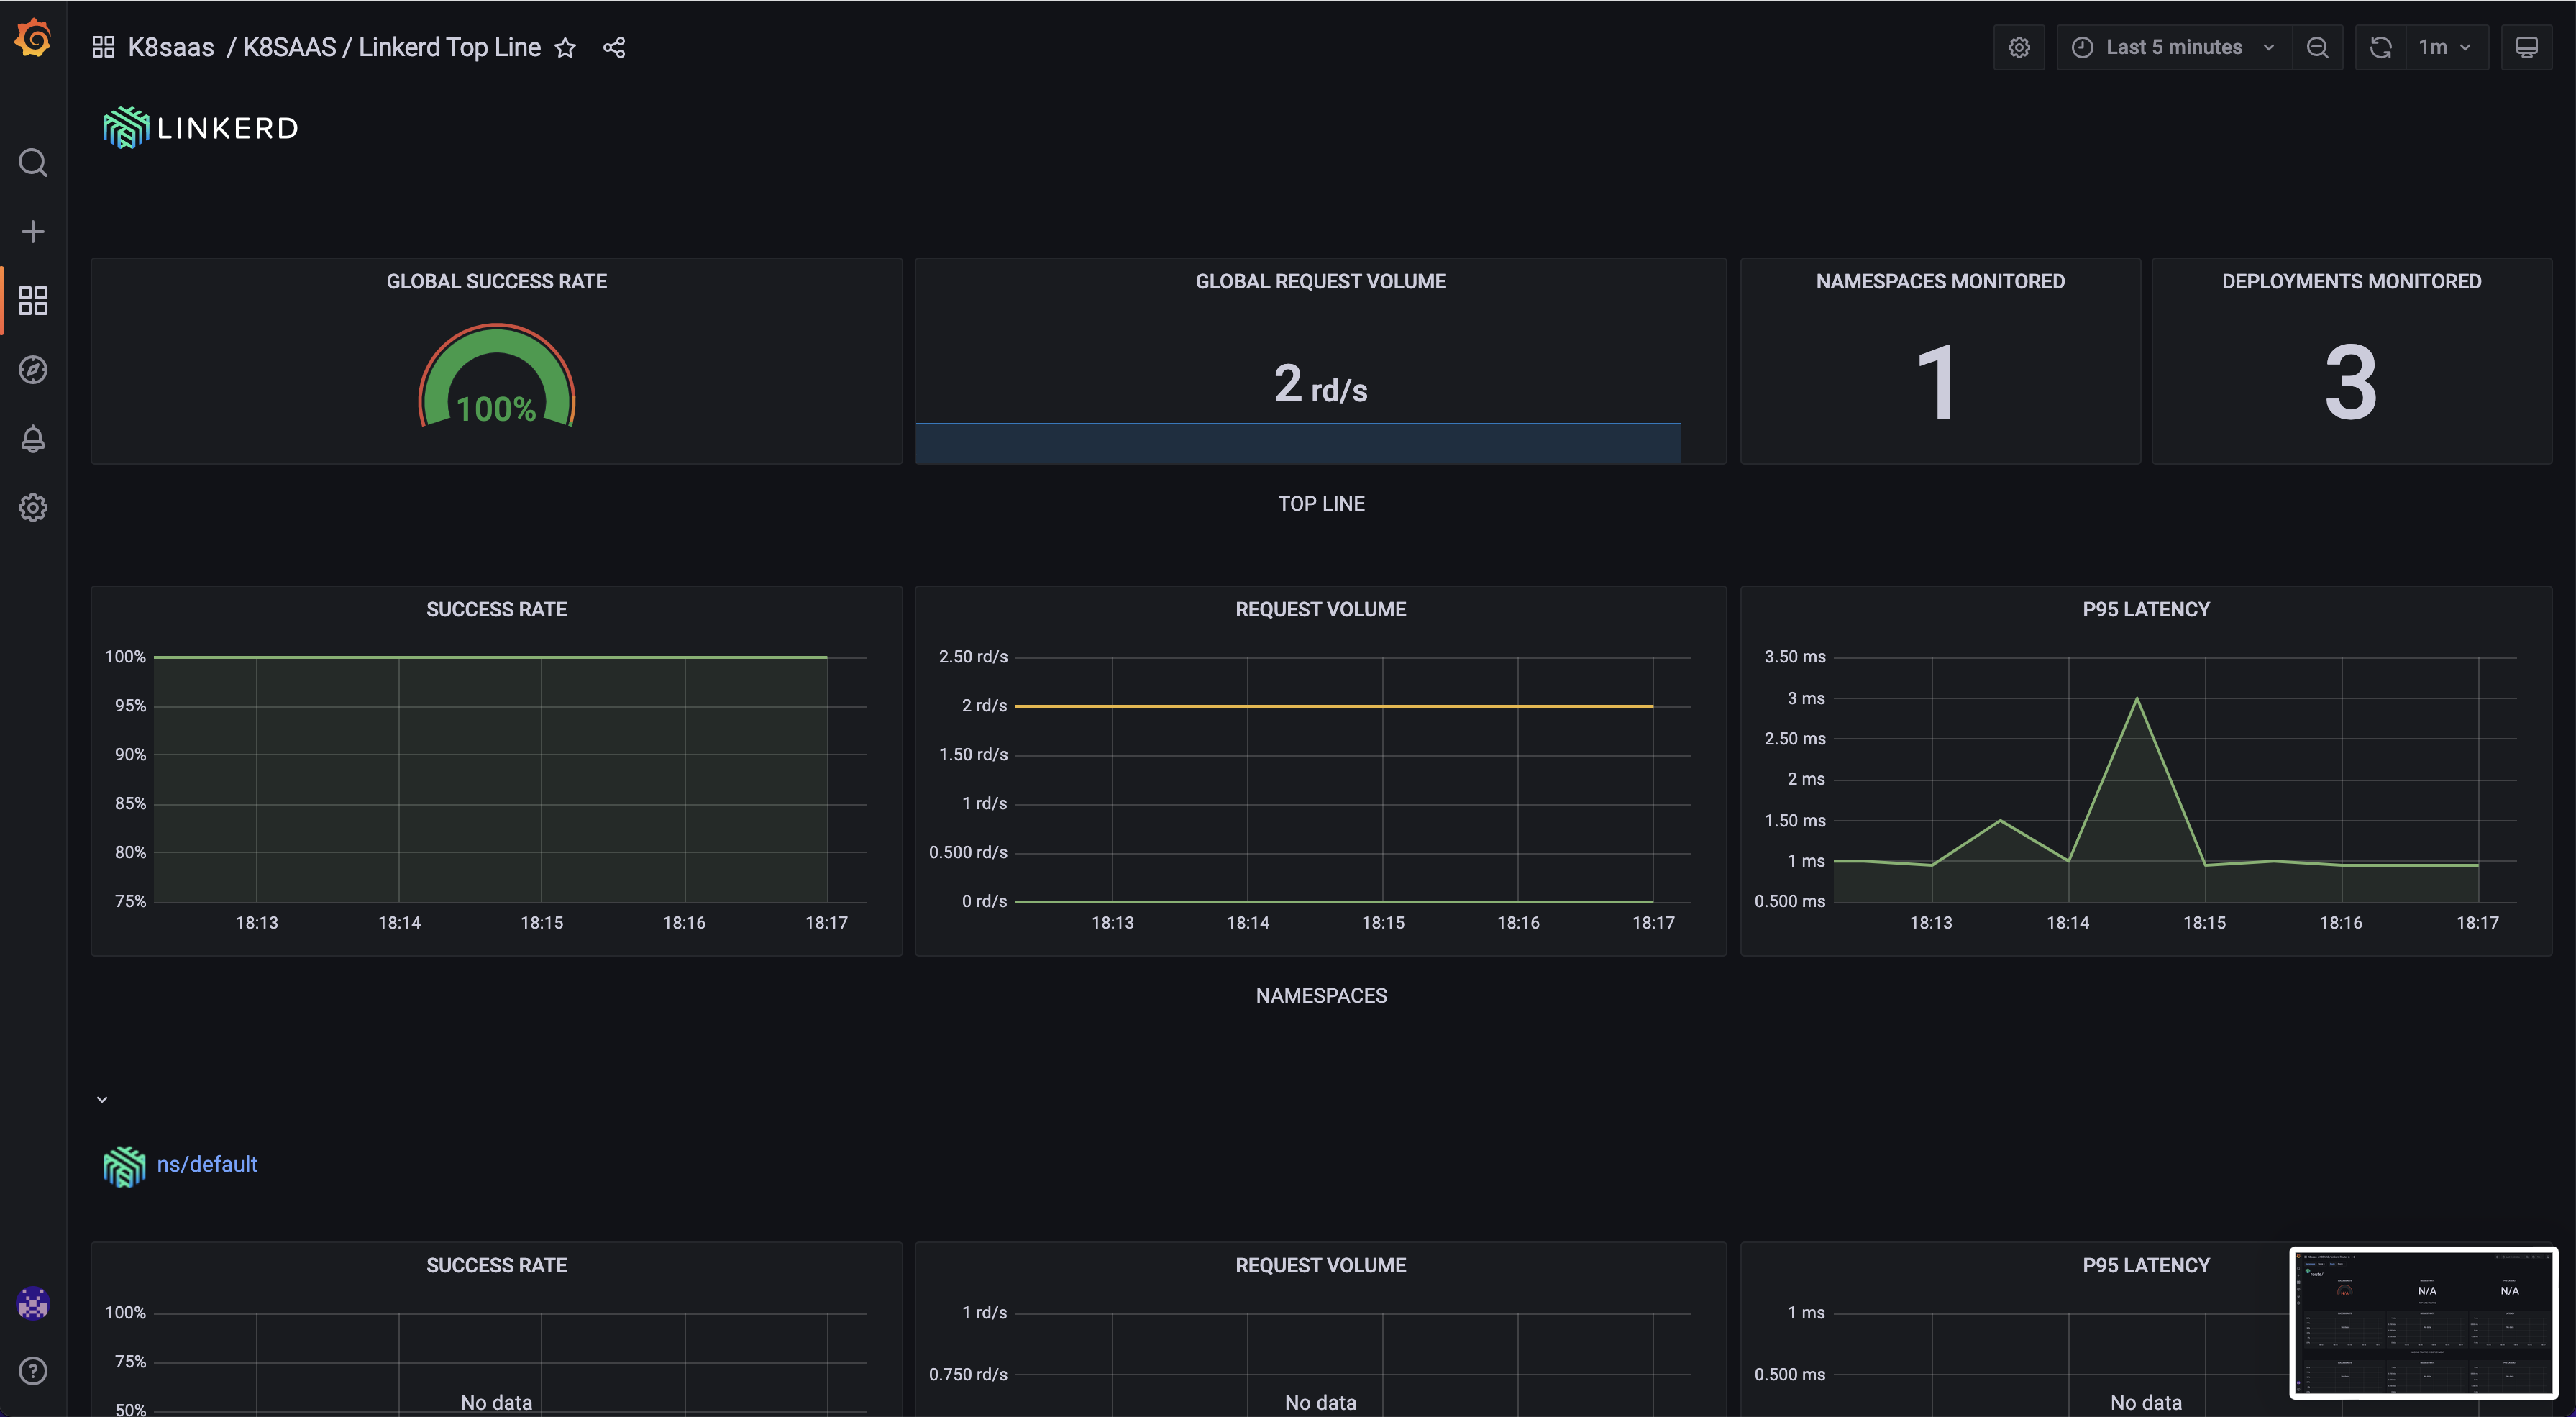
Linkerd Top Line
Goal: Monitor Linkerd service mesh
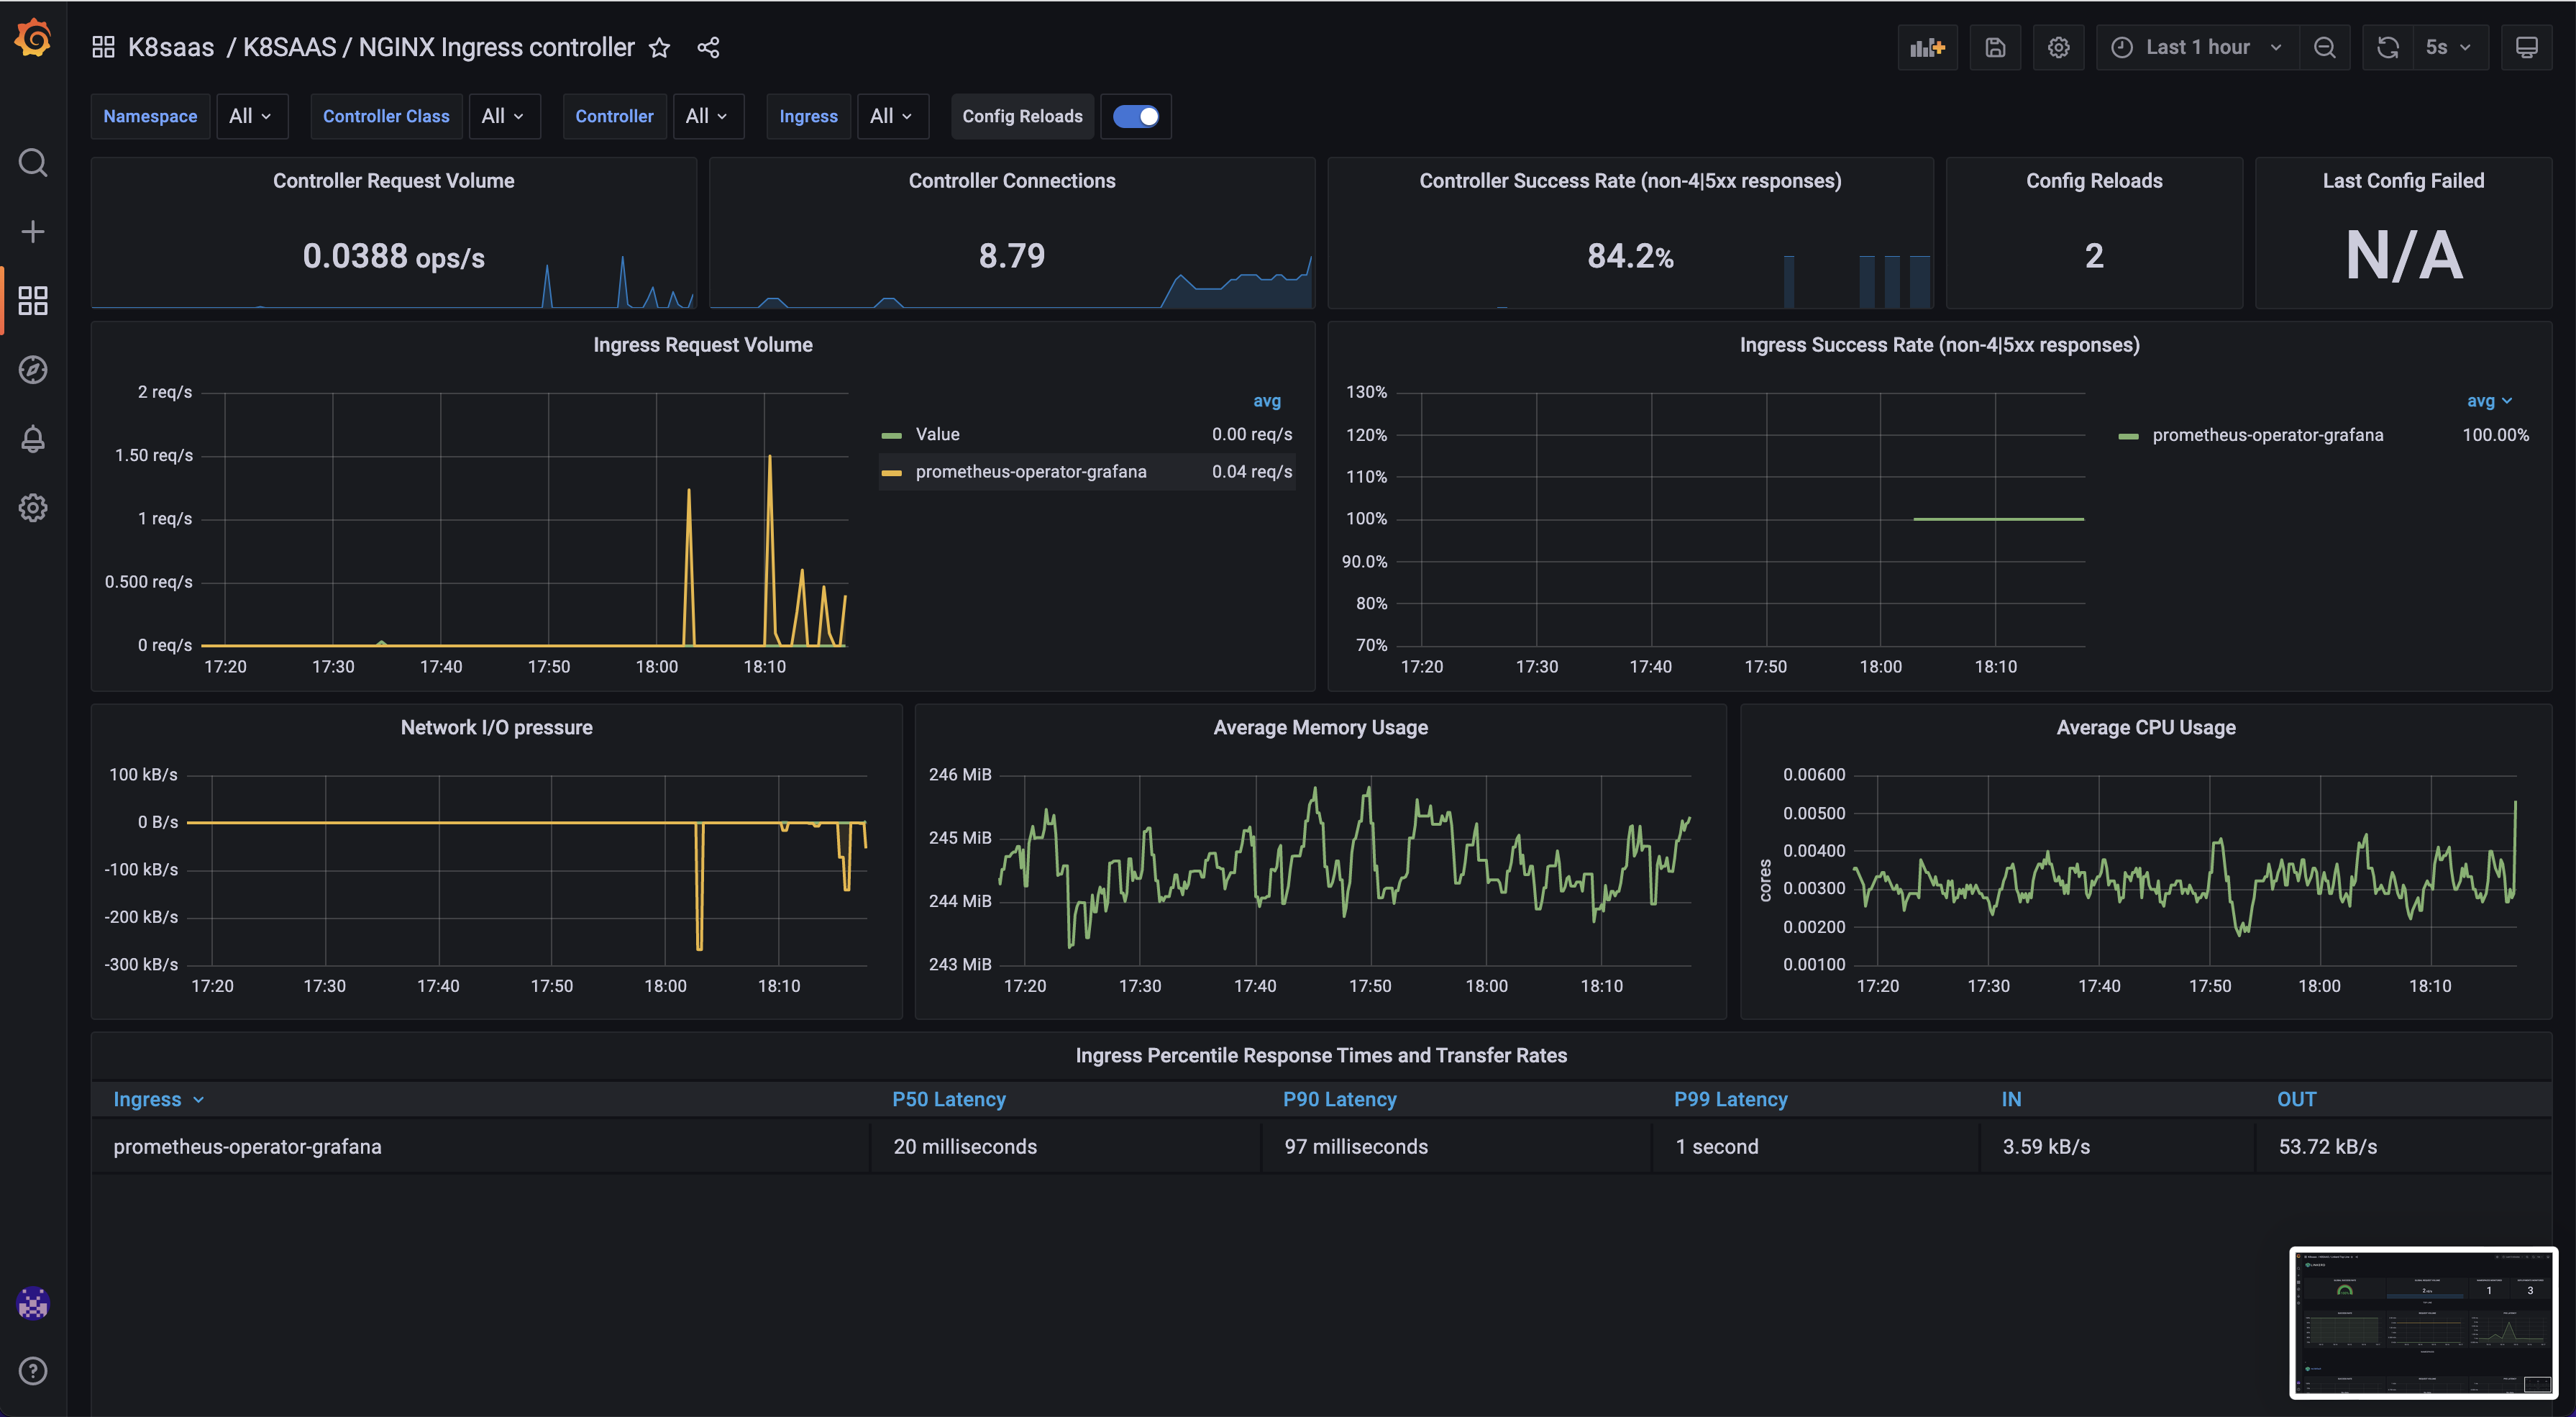
NGINX ingress controller
Goal: Monitor your ingress performance and issues
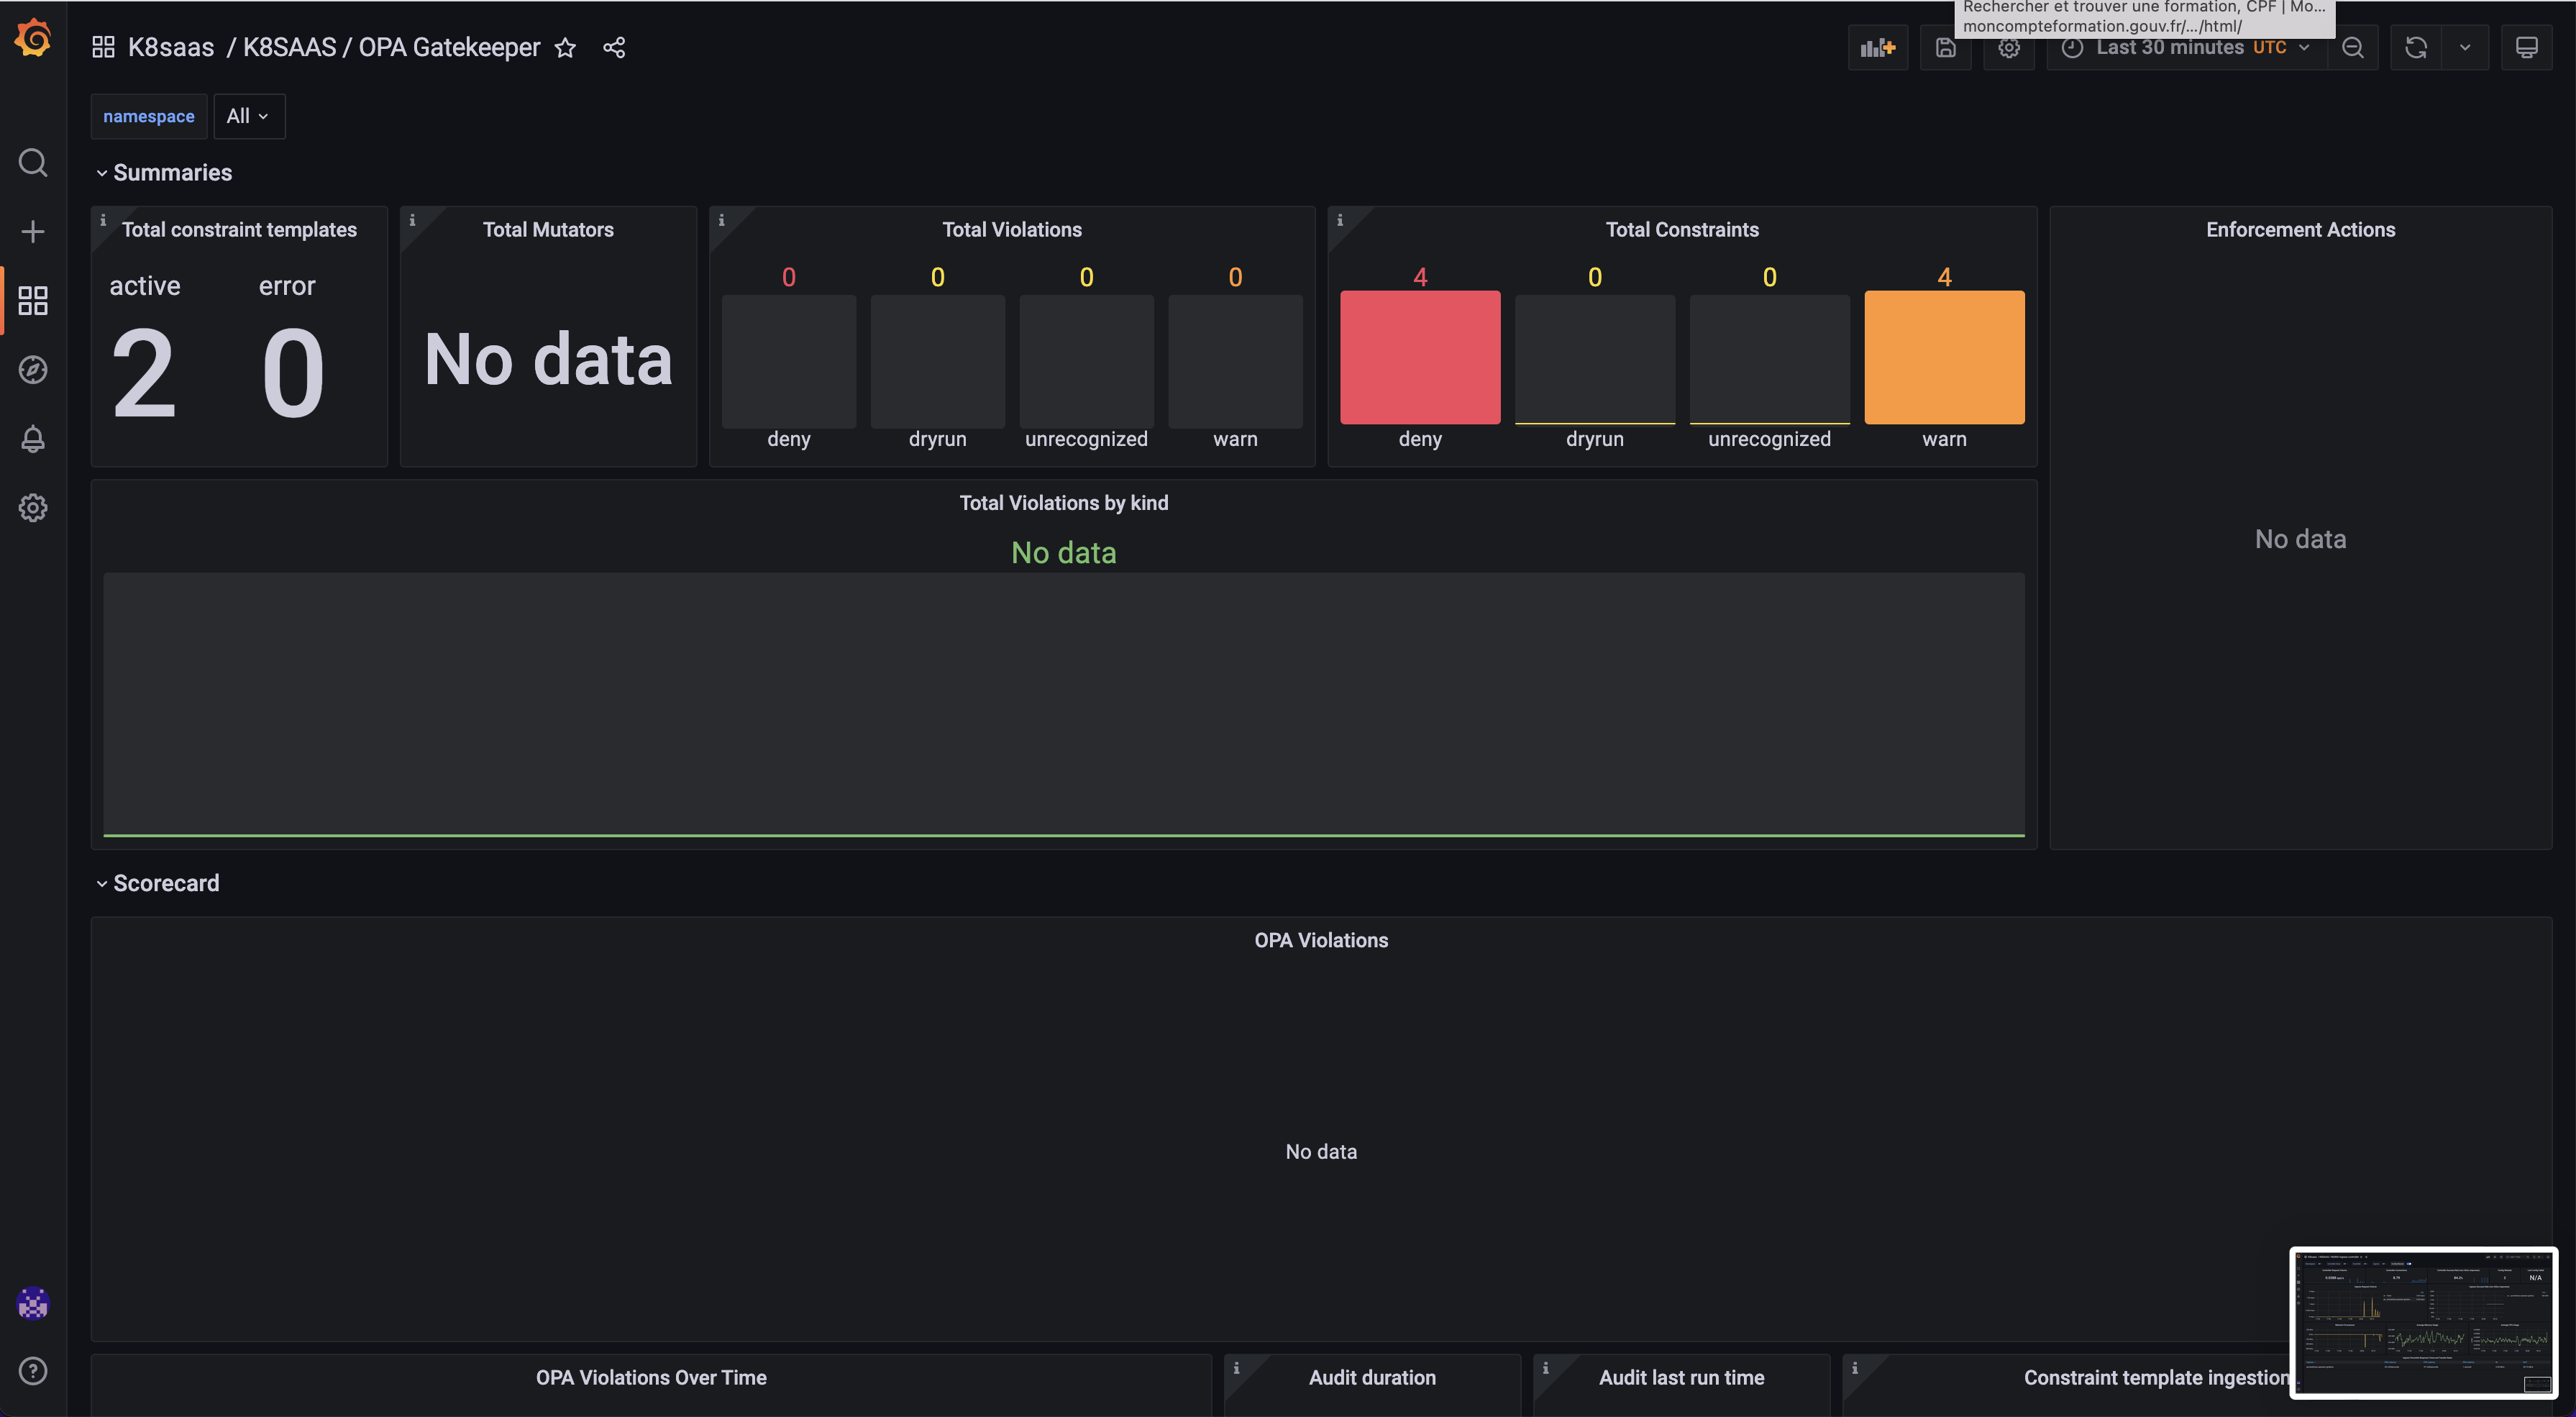
OPA Gatekeeper
Goal: Discover the kubernetes policy deployed
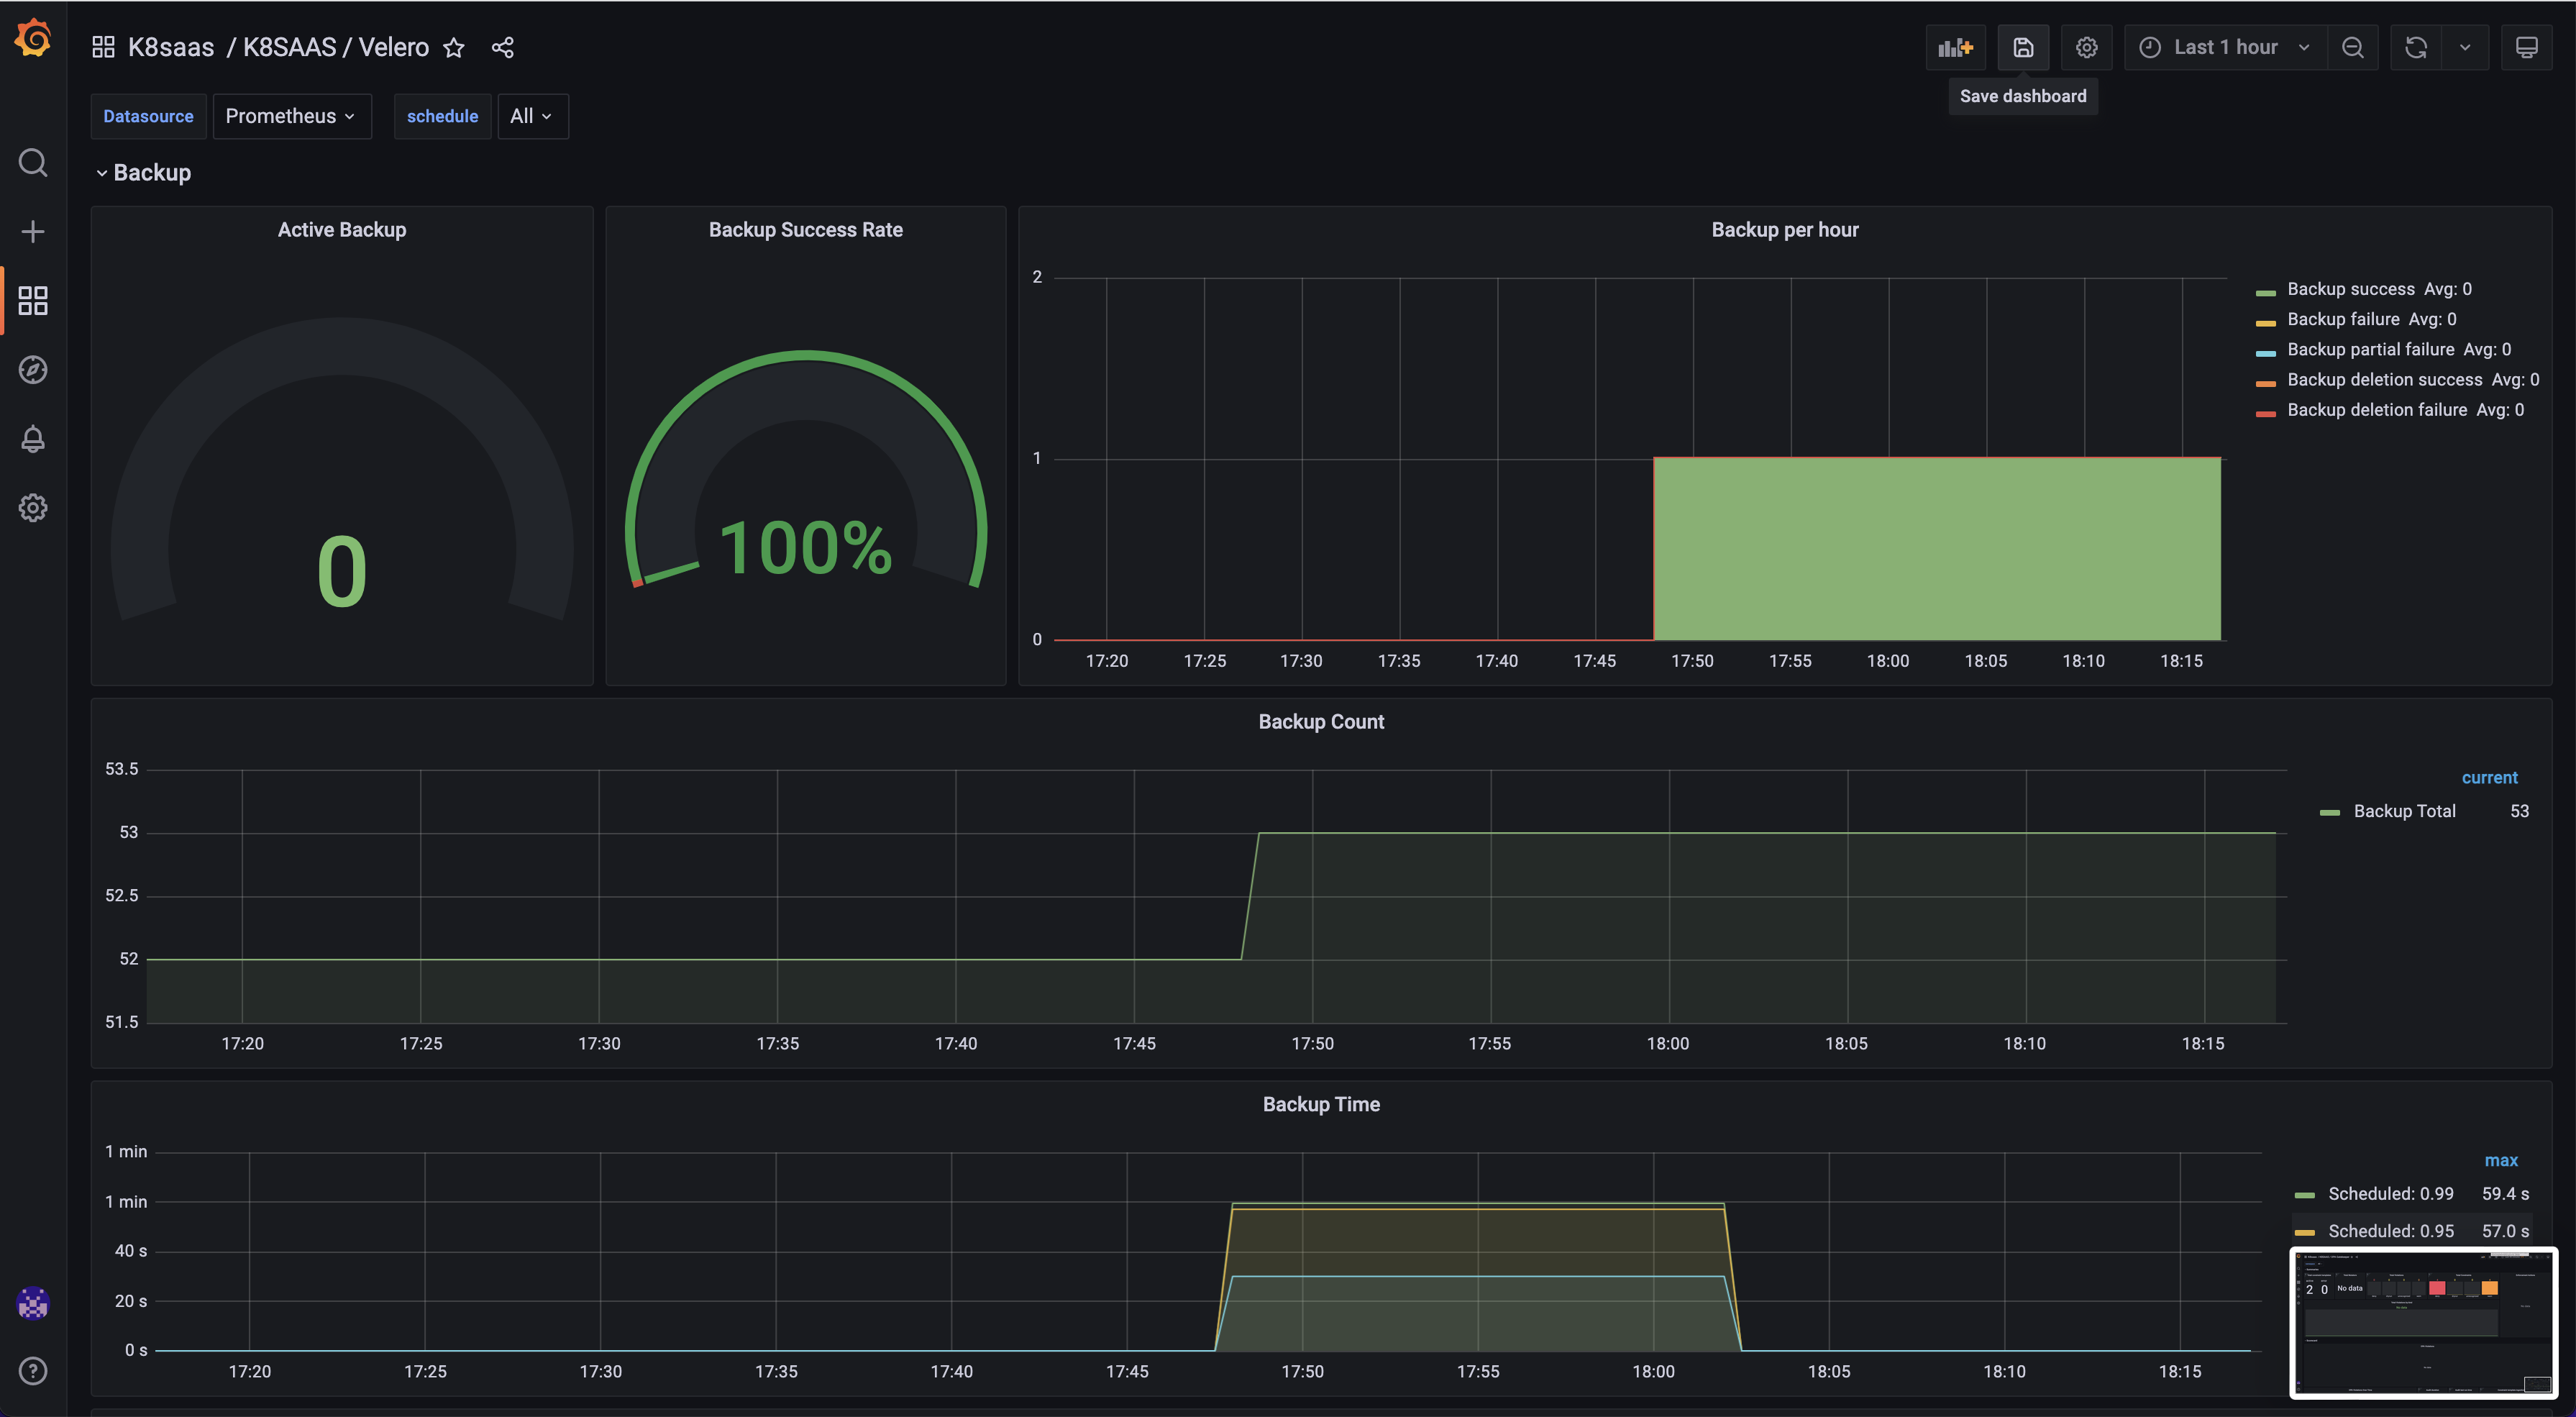
Velero
Goal: Monitor your backups
HOWTO
Make a query
here is the query to help you copy & past:
count by(namespace,reason) (kube_pod_container_status_terminated_reason{reason!="Completed",namespace="$namespace"} !=0 )
count by(namespace,reason) (kube_pod_container_status_waiting_reason{namespace="$namespace"} !=0 )
Then, you should have a look to the collected metrics:
- CertificateSigningRequest Metrics
- ConfigMap Metrics
- CronJob Metrics
- DaemonSet Metrics
- Deployment Metrics
- Endpoint Metrics
- Horizontal Pod Autoscaler Metrics
- Ingress Metrics
- Job Metrics
- Lease Metrics
- LimitRange Metrics
- MutatingWebhookConfiguration Metrics
- Namespace Metrics
- NetworkPolicy Metrics
- Node Metrics
- PersistentVolume Metrics
- PersistentVolumeClaim Metrics
- Pod Disruption Budget Metrics
- Pod Metrics
- ReplicaSet Metrics
- ReplicationController Metrics
- ResourceQuota Metrics
- Secret Metrics
- Service Metrics
- StatefulSet Metrics
- StorageClass Metrics
- ValidatingWebhookConfiguration Metrics
- VerticalPodAutoscaler Metrics
- VolumeAttachment Metrics
source: kube-state-metrics
Example:


Expose metrics from your applications
Although some services and applications are already adopting the Prometheus metrics format and provide endpoints for this purpose, many popular server applications like Nginx or PostgreSQL are much older than the Prometheus metrics / OpenMetrics popularization. This complicates getting metrics from them into a single pane of glass, since they usually have their own metrics formats and exposition methods.
If you are trying to unify your metric pipeline across many microservices and hosts using Prometheus metrics, this may be a problem.
To work around this hurdle, the Prometheus community is creating and maintaining a vast collection of Prometheus exporters. An exporter is a “translator” or “adapter” program that is able to collect the server native metrics (or generate its own data observing the server behavior) and re-publish them using the Prometheus metrics format and HTTP protocol transports.
diagram showing how Prometheus exporters work These exporter small binaries can be co-located in the same pod as a sidecar of the main server that is being monitored, or isolated in their own pod or even a different infrastructure.
The exporter exposes the service metrics converted into Prometheus metrics, so you just need to scrape the exporter.
Here you can find an aggregated list of prometheus exporters.
make prometheus scrape your applications metrics
A ServiceMonitor describes the set of targets to be monitored by Prometheus.

The Prometheus resource includes a field called serviceMonitorSelector, which defines a selection of ServiceMonitors to be used. By default and before the version v0.19.0, ServiceMonitors must be installed in the same namespace as the Prometheus instance. With the Prometheus Operator v0.19.0 and above, ServiceMonitors can be selected outside the Prometheus namespace via the serviceMonitorNamespaceSelector field of the Prometheus resource.
First, deploy three instances of a simple example application, which listens and exposes metrics on port 8080.
apiVersion: apps/v1
kind: Deployment
metadata:
  name: example-app
  namespace: customer-namespaces
spec:
  replicas: 3
  selector:
    matchLabels:
      app: example-app
  template:
    metadata:
      labels:
        app: example-app
    spec:
      containers:
      - name: example-app
        image: fabxc/instrumented_app
        ports:
        - name: web
          containerPort: 8080
The ServiceMonitor has a label selector to select Services and their underlying Endpoint objects. The Service object for the example application selects the Pods by the app label having the example-app value. The Service object also specifies the port on which the metrics are exposed.
kind: Service
apiVersion: v1
metadata:
  name: example-app
  namespace: customer-namespaces
  labels:
    app: example-app
spec:
  selector:
    app: example-app
  ports:
  - name: web
    port: 8080
This Service object is discovered by a ServiceMonitor, which selects in the same way. The app label must have the value example-app.
apiVersion: monitoring.coreos.com/v1
kind: ServiceMonitor
metadata:
  name: example-app
  namespace: customer-namespaces
  labels:
    team: frontend
spec:
  selector:
    matchLabels:
      app: example-app
  endpoints:
  - port: web
Import your own dashboard as code
It was brought to our attention that we offer persistency on Grafana. Although due to breaking change on Grafana/Prometheus we delete the volume to accelerate the migration. Due to this, we highly suggest to export your dashboard and deploy them using the link below.
Next step
Go back to homepage