HOWTO Bring your own dashboard as code
You're now able to provide your own Grafana dashboard(s) as code. Grafana now scans the configmaps (with proper annotations) deployed in your namespaces and dynamically provision Grafana
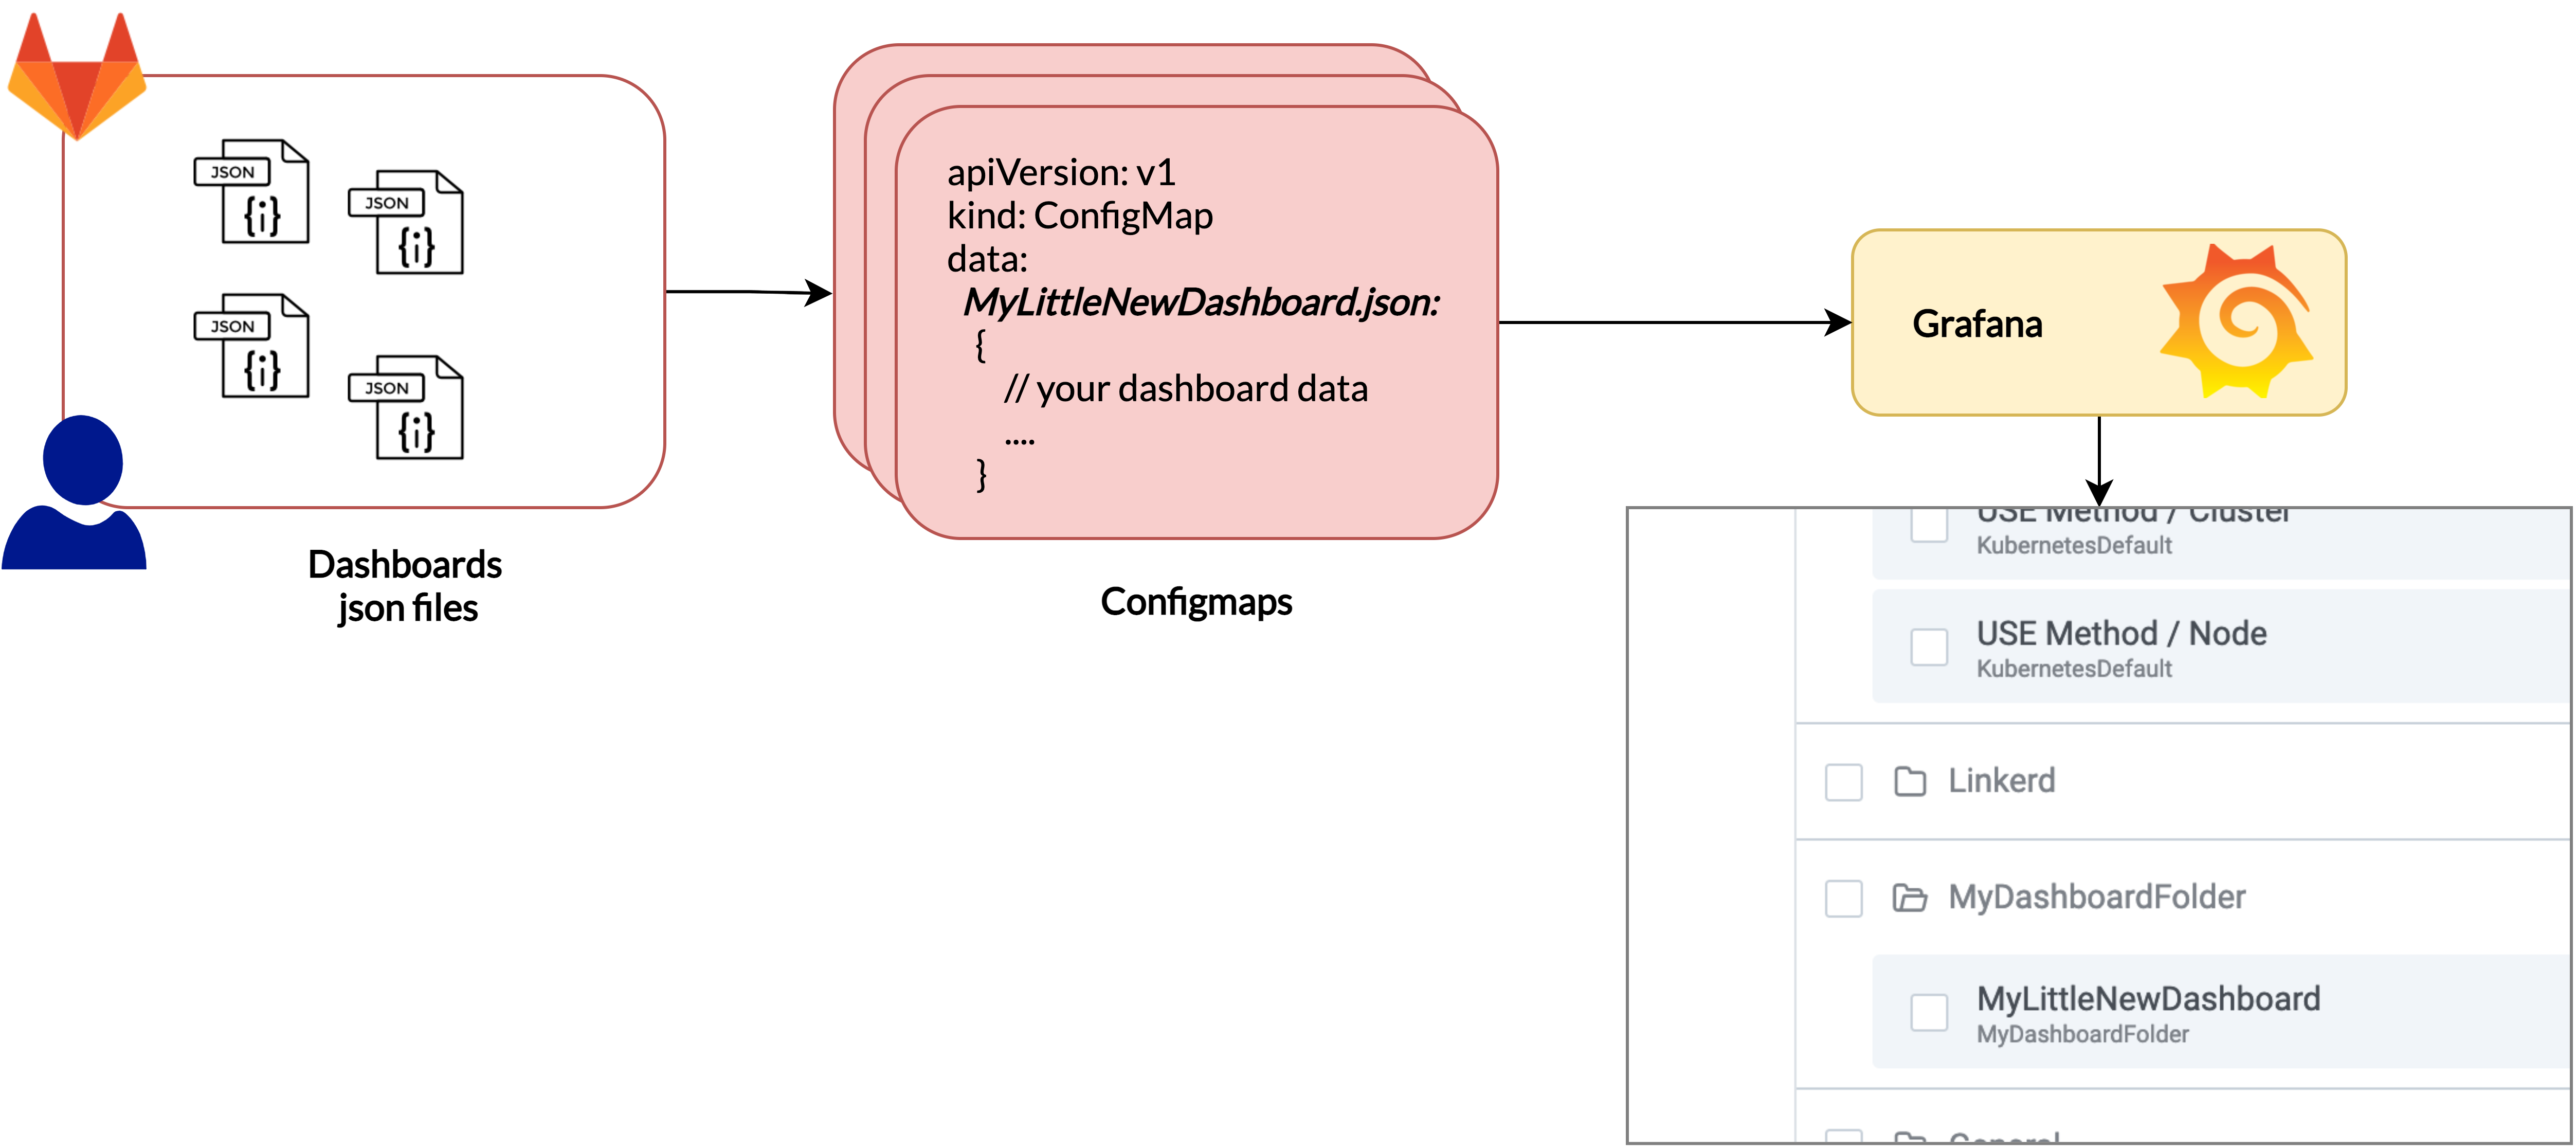
The goal of this documentation is to show you how to :
-
Create / copy a Grafana dashboard
-
Export it to a JSON model
-
Create a ConfigMap from the JSON model
-
Deploy this ConfigMap in your CICD
Create
Start from scratch
-
Connect to your Grafana instance
-
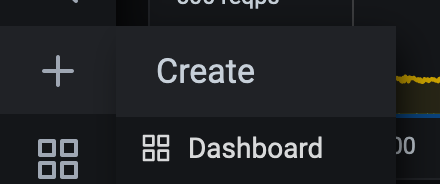
Click Create
-
Add your panel(s) with default as datasource
-
Apply your changes
-
Then go to Dashboard Settings
-
Set a dashboard name in General/Name field
-
Set dashboard tags in tags field
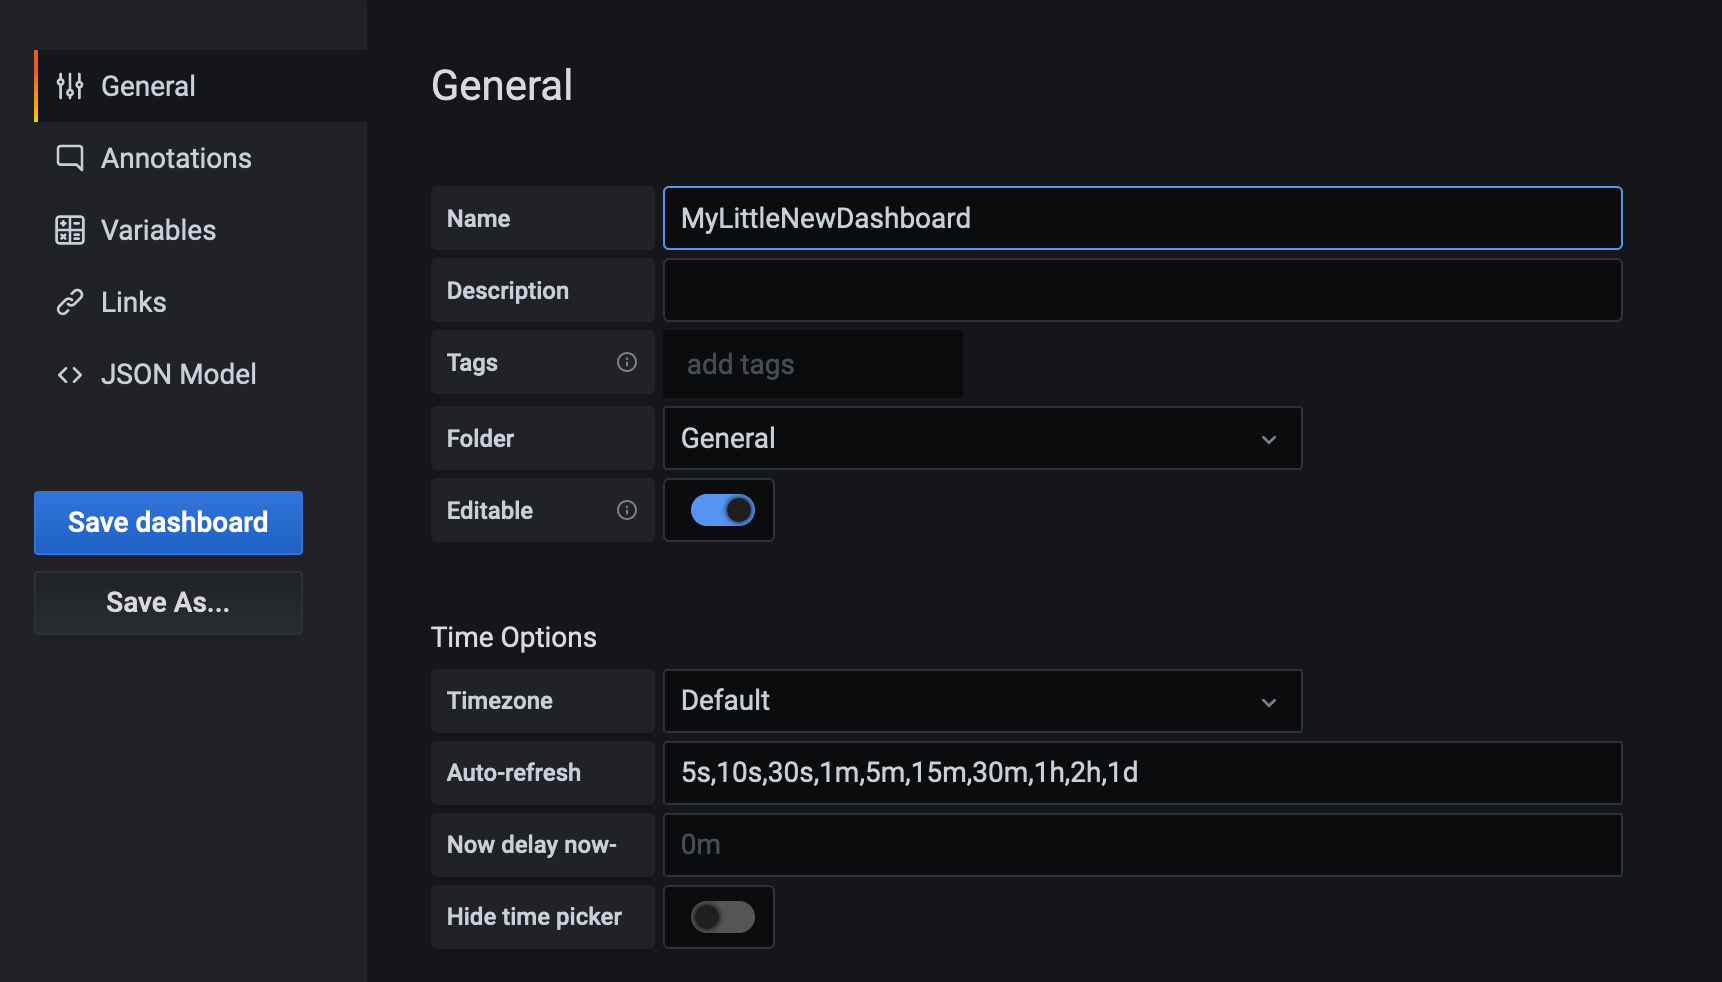
You can now see the JSON model and save it to a file. Next step is to create a configmap with this json model
Copy an existing dashboard
TODO
Create your configmap
With you dashboard json as dashboard.json :
kubectl create configmap \
   your-dashboard-name \
   --from-file=./dashboard.json \
   --dry-run=client -o yaml  \
   > dashboard.yaml
There is an example :
apiVersion: v1
data:
  dashboard.json: |
    {
      "annotations": {
        "list": [
          {
            "builtIn": 1,
            "datasource": "-- Grafana --",
            "enable": true,
            "hide": true,
            "iconColor": "rgba(0, 211, 255, 1)",
            "name": "Annotations & Alerts",
            "type": "dashboard"
          }
        ]
      },
      "editable": true,
      "gnetId": null,
      "graphTooltip": 0,
      "id": null,
      "links": [],
      "panels": [
        {
          "aliasColors": {},
          "bars": false,
          "dashLength": 10,
          "dashes": false,
          "datasource": null,
          "fieldConfig": {
            "defaults": {
              "custom": {}
            },
            "overrides": []
          },
          "fill": 1,
          "fillGradient": 0,
          "gridPos": {
            "h": 9,
            "w": 12,
            "x": 0,
            "y": 0
          },
          "hiddenSeries": false,
          "id": 2,
          "legend": {
            "avg": false,
            "current": false,
            "max": false,
            "min": false,
            "show": true,
            "total": false,
            "values": false
          },
          "lines": true,
          "linewidth": 1,
          "nullPointMode": "null",
          "options": {
            "alertThreshold": true
          },
          "percentage": false,
          "pluginVersion": "7.3.5",
          "pointradius": 2,
          "points": false,
          "renderer": "flot",
          "seriesOverrides": [],
          "spaceLength": 10,
          "stack": false,
          "steppedLine": false,
          "targets": [
            {
              "expr": "up{app=\"blackduck\"}",
              "interval": "",
              "legendFormat": "",
              "refId": "A"
            }
          ],
          "thresholds": [],
          "timeFrom": null,
          "timeRegions": [],
          "timeShift": null,
          "title": "Panel Title",
          "tooltip": {
            "shared": true,
            "sort": 0,
            "value_type": "individual"
          },
          "type": "graph",
          "xaxis": {
            "buckets": null,
            "mode": "time",
            "name": null,
            "show": true,
            "values": []
          },
          "yaxes": [
            {
              "format": "short",
              "label": null,
              "logBase": 1,
              "max": null,
              "min": null,
              "show": true
            },
            {
              "format": "short",
              "label": null,
              "logBase": 1,
              "max": null,
              "min": null,
              "show": true
            }
          ],
          "yaxis": {
            "align": false,
            "alignLevel": null
          }
        }
      ],
      "schemaVersion": 26,
      "style": "dark",
      "tags": [
        "myapp",
        "mytenant"
      ],
      "templating": {
        "list": []
      },
      "time": {
        "from": "now-6h",
        "to": "now"
      },
      "timepicker": {},
      "timezone": "",
      "title": "MyLittleNewDashboard",
      "uid": null,
      "version": 0
    }
kind: ConfigMap
metadata:
  creationTimestamp: null
  name: your-dashboard-name
Add annotations
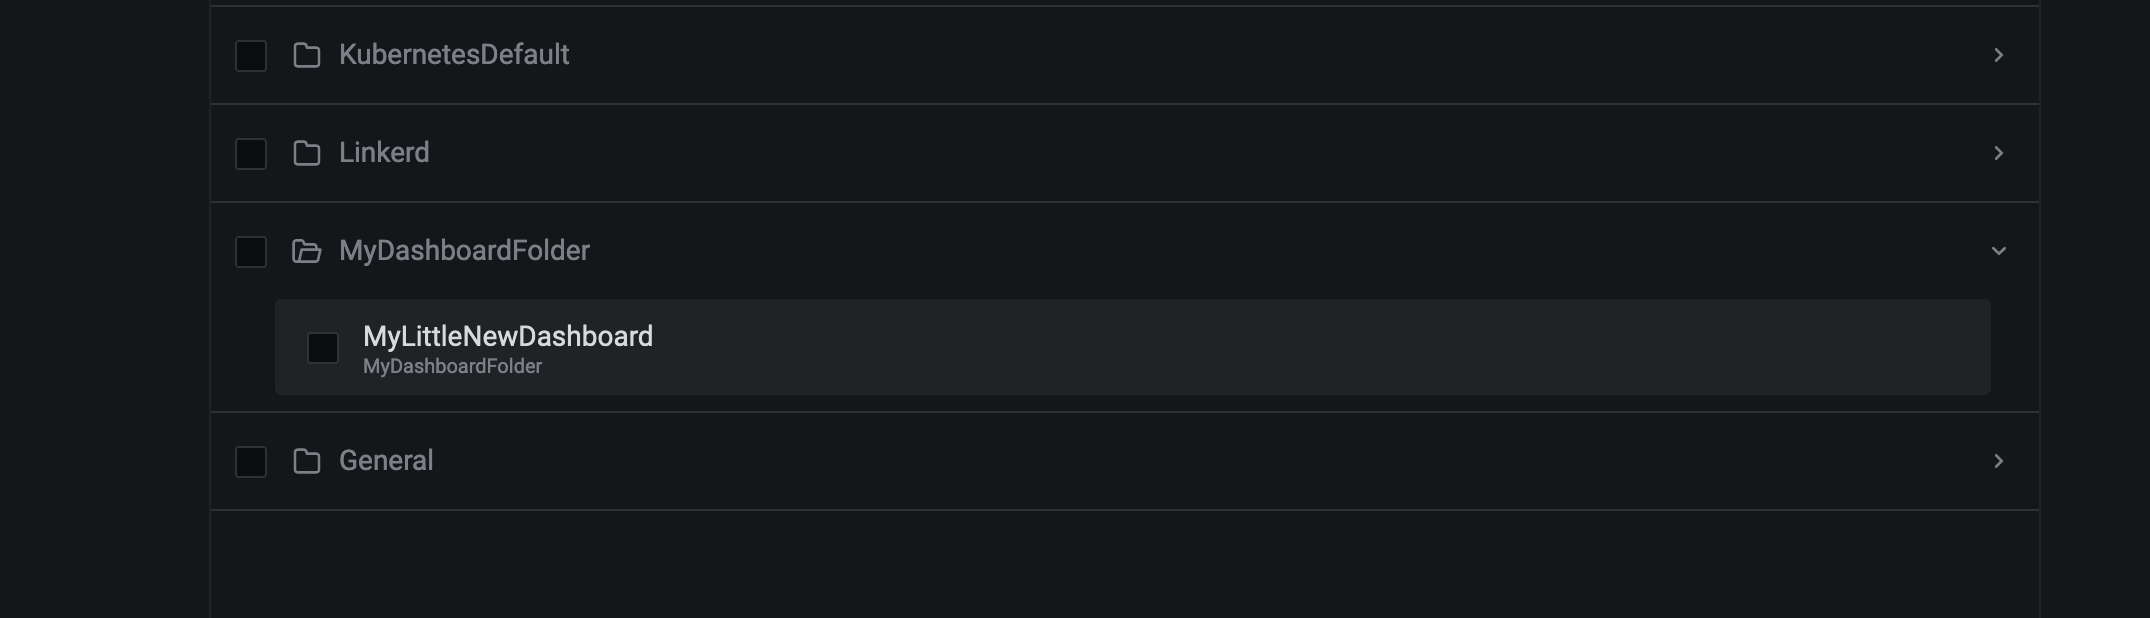
These annotation will indicate to Grafana to integrate the configmap as a dashboard and in which folder to deploy the dashboard
From :
kind: ConfigMap
metadata:
  creationTimestamp: null
  name: your-dashboard-name
to
kind: ConfigMap
metadata:
  creationTimestamp: null
  name: your-dashboard-name
  namespace: customer-namespaces
  annotations:
    grafana_folder: /tmp/dashboards/MyDashboardFolder
  labels:
    grafana_dashboard: "1"
metadata.namespace
Specify a namespace where to deploy this configmap You need to have access to this namespace
metadata.annoations.grafana_folder
The value MUST be a one level directory in /tmp/dashboards
Sub-directories are not yet supported
metadata.annoations.grafana_dashboard
1 to enable it, 0 disable it
You can now deploy this configmap using kubectl apply or your classic CICD pipeline