Setting Grafana Alerting
This documentation has been made with Grafana 9.3.6
Take note, Managed rule, Contact points and Notification policies are note saved with Velero, these settings should be save as code to be easily patch/reimported in case of an issue.
Creating a Grafana-managed alert rules
Add Grafana managed rule
- In the Grafana menu, click the Alerting (bell) icon to open the Alerting page listing existing alerts.
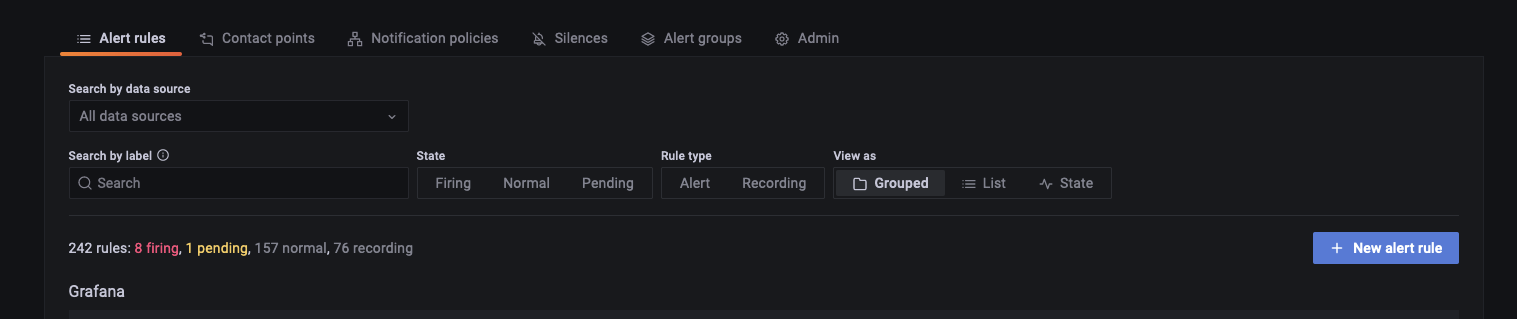
- Click New alert rule. The new alerting rule page opens where the Grafana managed alerts option is selected by default.
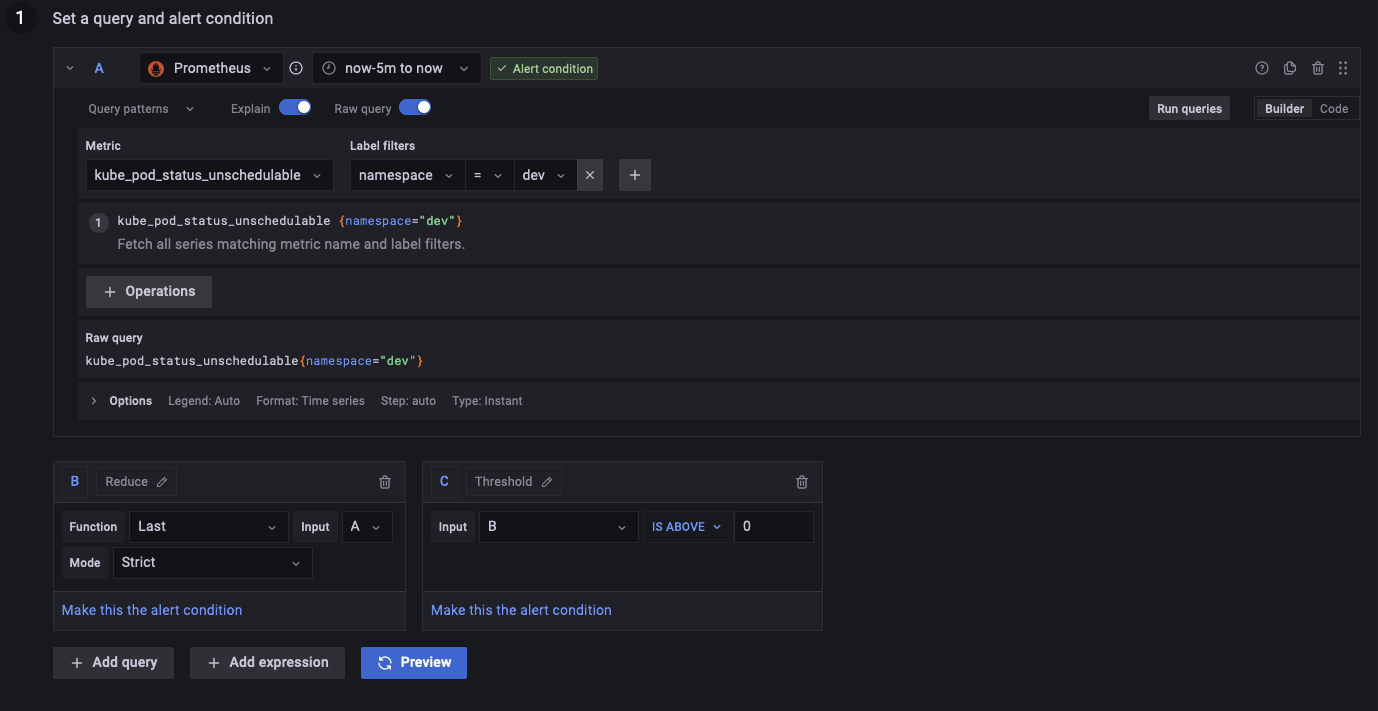
- In Step 1, add queries and expressions to evaluate, and then select the alert condition.
- For queries, select a data source from the drop-down.
- Add one or more queries or expressions.
- For each expression, select either Classic condition to create a single alert rule, or choose from Math, Reduce, Resample options to generate separate alert for each series. For details on these options, see Single and multi dimensional rule.
- Click Run queries to verify that the query is successful.
- Next, select the query or expression for your alert condition.
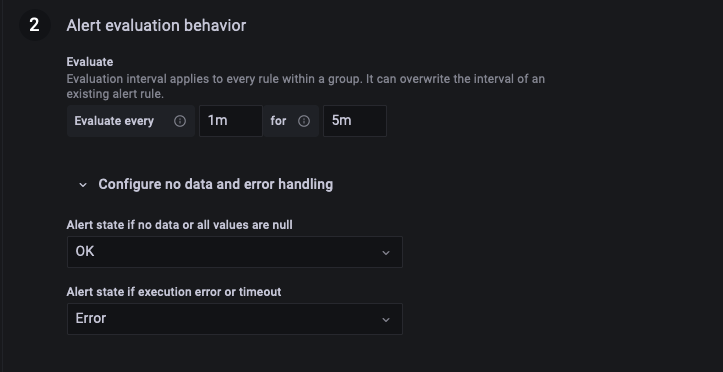
- In Step 2, specify the alert evaluation interval.
- From the Condition drop-down, select the query or expression to trigger the alert rule.
- For Evaluate every, specify the frequency of evaluation. Must be a multiple of 10 seconds. For examples, 1m, 30s.
- For Evaluate for, specify the duration for which the condition must be true before an alert fires.
noteOnce a condition is breached, the alert goes into the Pending state. If the condition remains breached for the duration specified, the alert transitions to the Firing state, otherwise it reverts back to the Normal state.
- In Configure no data and error handling, configure alerting behavior in the absence of data. Use the guidelines in No data and error handling.
- Click Preview alerts to check the result of running the query at this moment. Preview excludes no data and error handling.
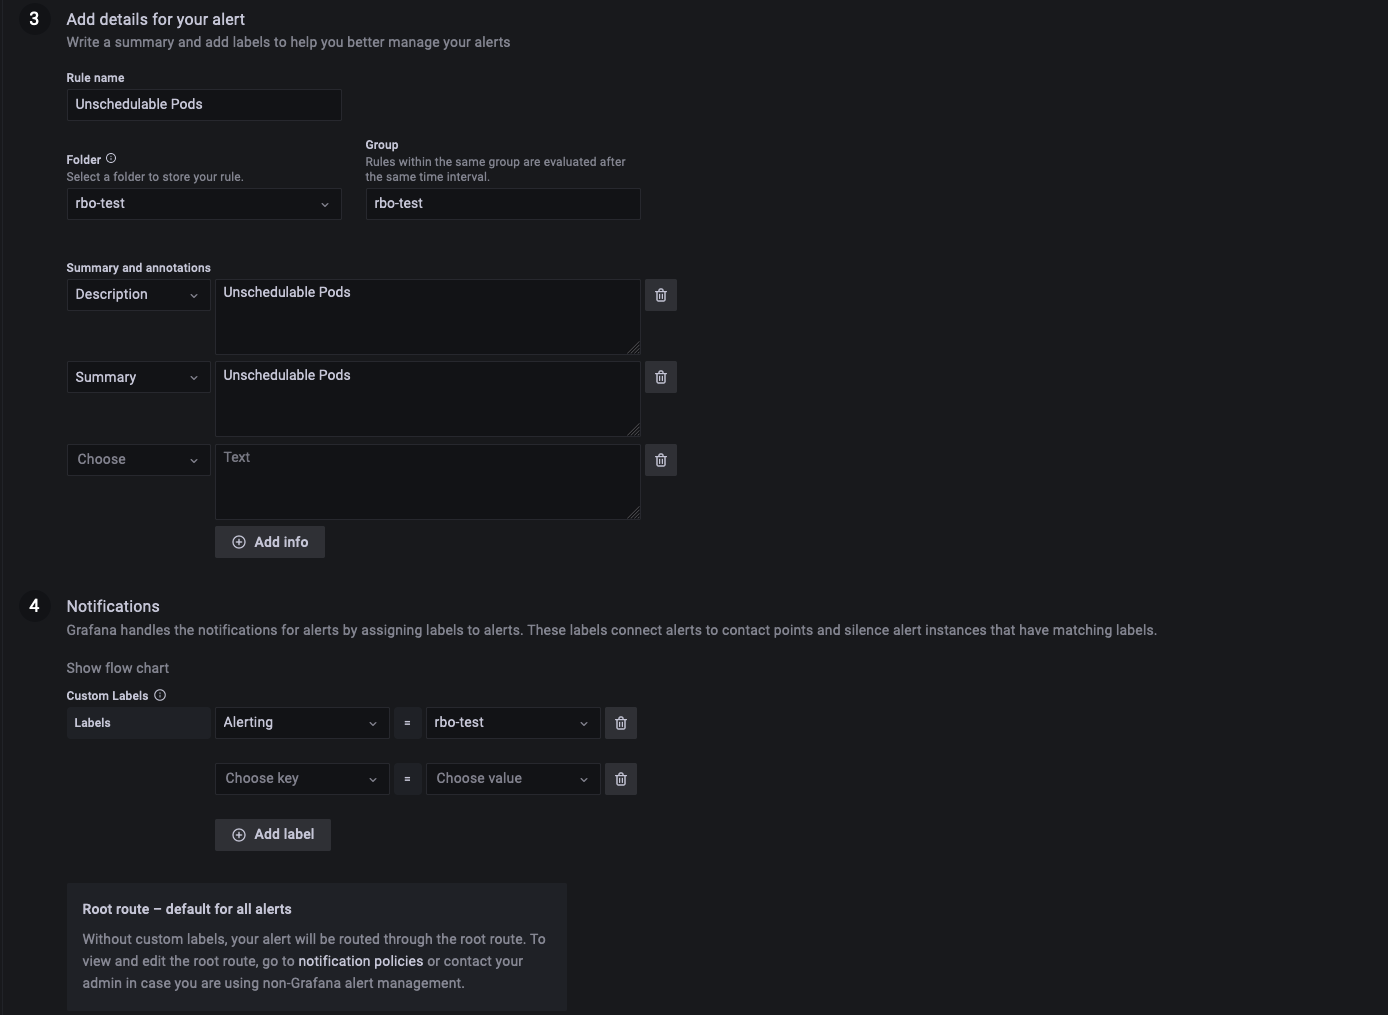
- In Step 3, add the rule name, storage location, rule group, as well as additional metadata associated with the rule.
- In Rule name, add a descriptive name. This name is displayed in the alert rule list. It is also the alertname label for every alert instance that is created from this rule.
- From the Folder drop-down, select the folder where you want to store the rule.
- For Group, specify a pre-defined group. Newly created rules are appended to the end of the group. Rules within a group are run sequentially at a regular interval, with the same evaluation time.
- Add a description and summary to customize alert messages. Use the guidelines in Annotations and labels for alerting.
- Add Runbook URL, panel, dashboard, and alert IDs.
- Add custom labels.
- Click Save to save the rule or Save and exit to save the rule and go back to the Alerting page.
- Next, create a for the rule.
Manage contact points
Add a contact point
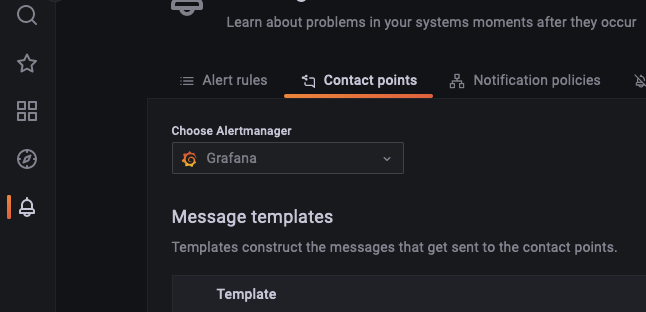
- In the Grafana menu, click the Alerting (bell) icon to open the Alerting page listing existing alerts.
- Click Contact points to open the page listing existing contact points.
- Click New contact point.
Here we will use Microsoft Team as a contact point
- From the Alertmanager dropdown, select an Alertmanager. By default, Grafana Alertmanager is selected.
- In Name, enter a descriptive name for the contact point.
- From Contact point type, select a type and fill out mandatory fields. For example, if you choose email, enter the email addresses. Or if you choose Slack, enter the Slack channel(s) and users who should be contacted.
- Some contact point types, like email or webhook, have optional settings. In Optional settings, specify additional settings for the selected contact point type.
- In Notification settings, optionally select Disable resolved message if you do not want to be notified when an alert resolves.
- To add another contact point type, click New contact point type and repeat steps 6 through 8.
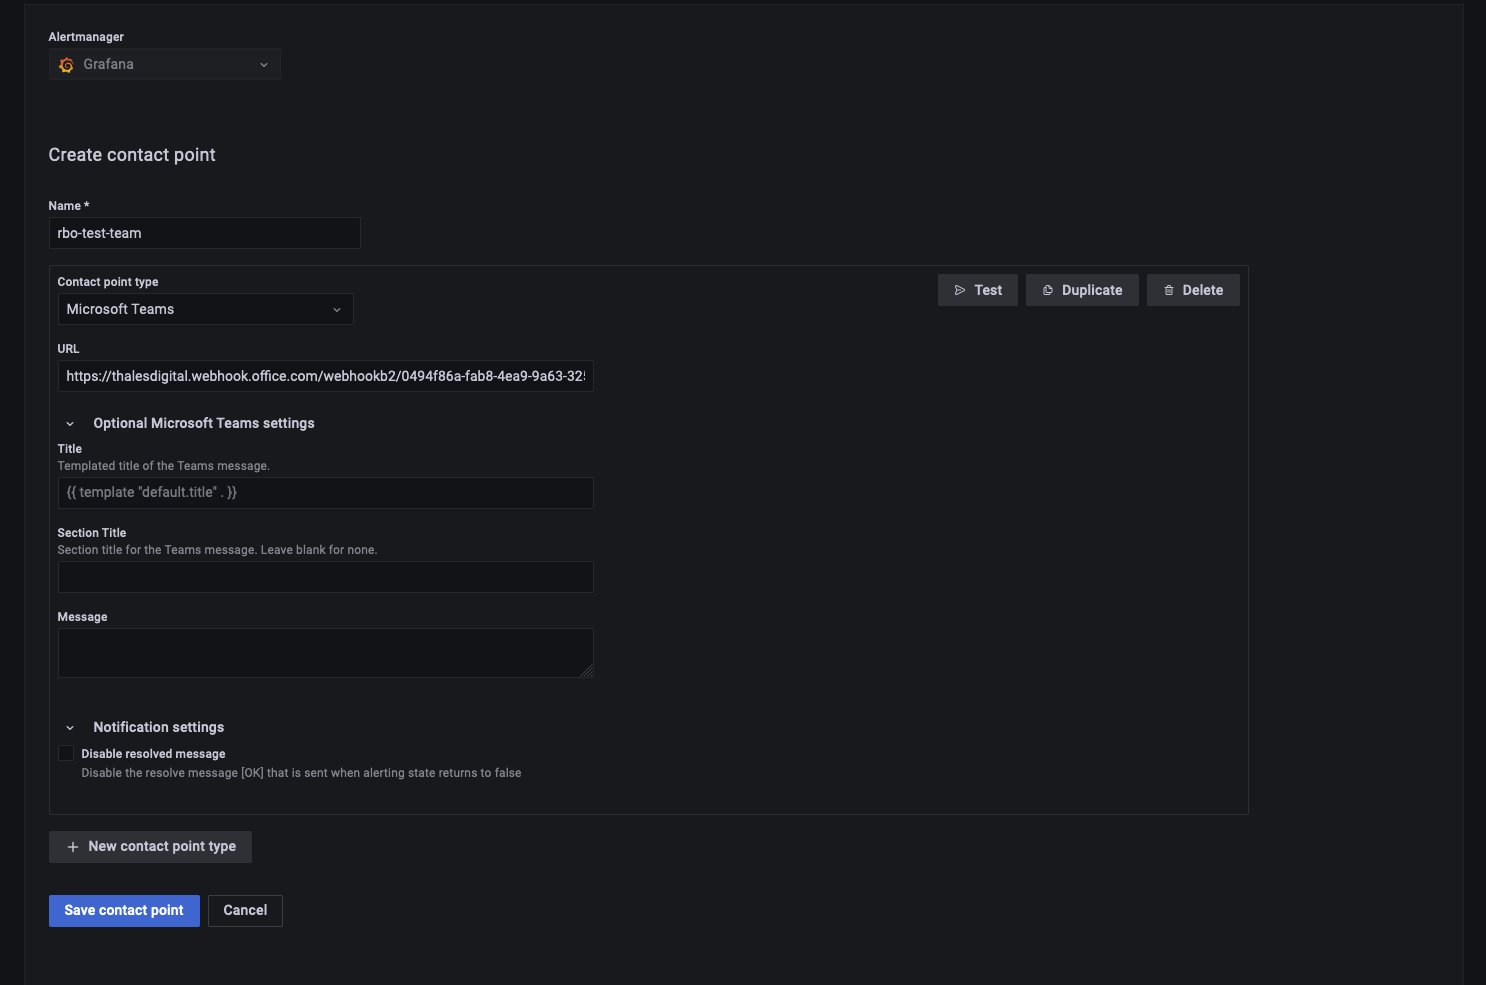
- Click Save contact point to save your changes.
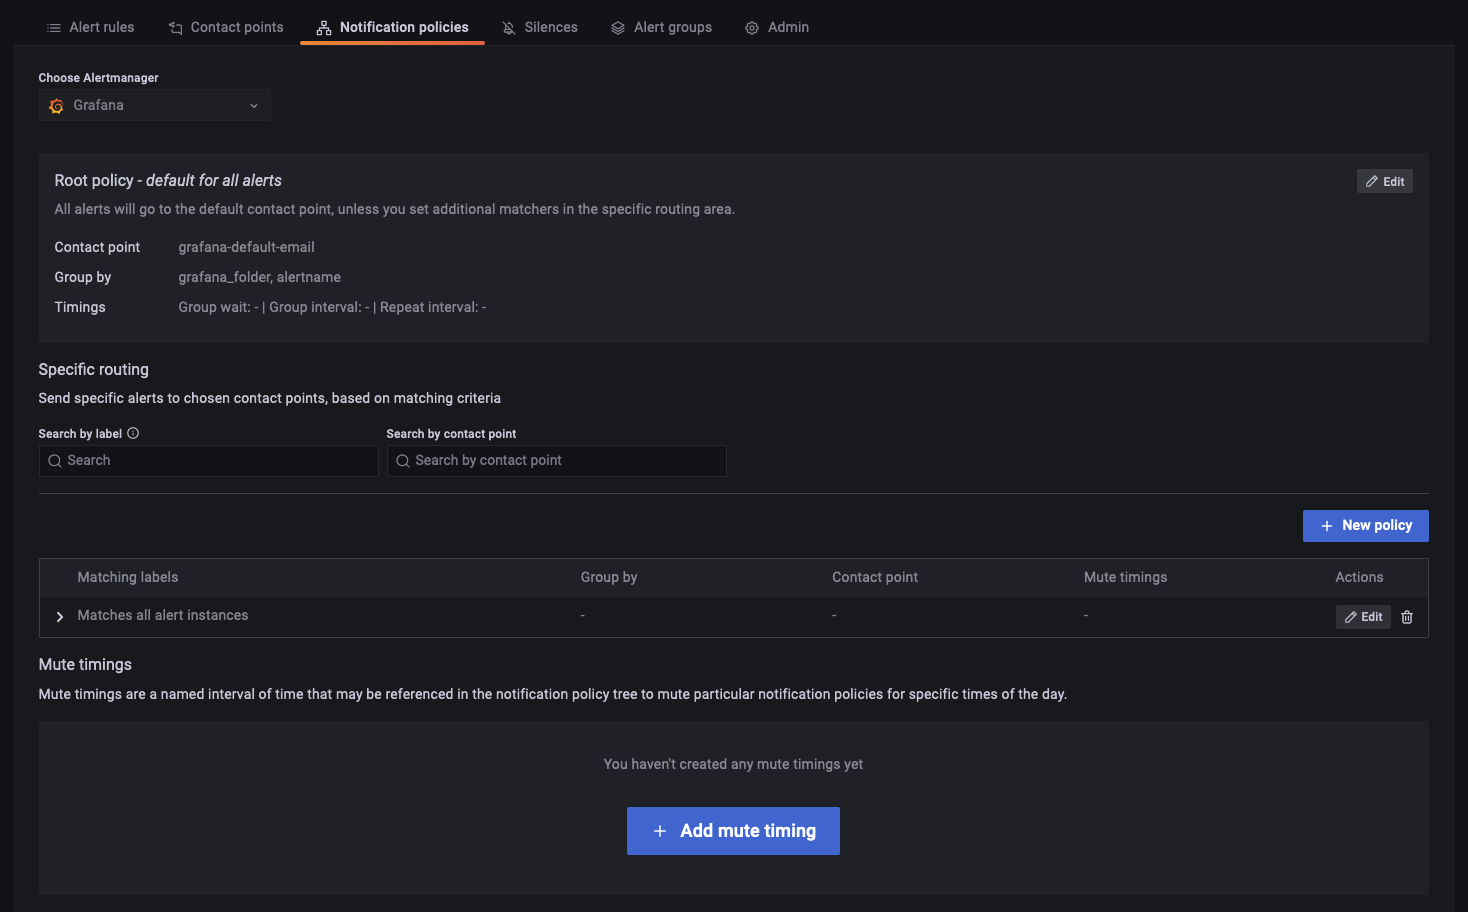
Manage notification policies
Add new specific policy
- In the Grafana menu, click the Alerting (bell) icon to open the Alerting page listing existing alerts.
- Click Notification policies.
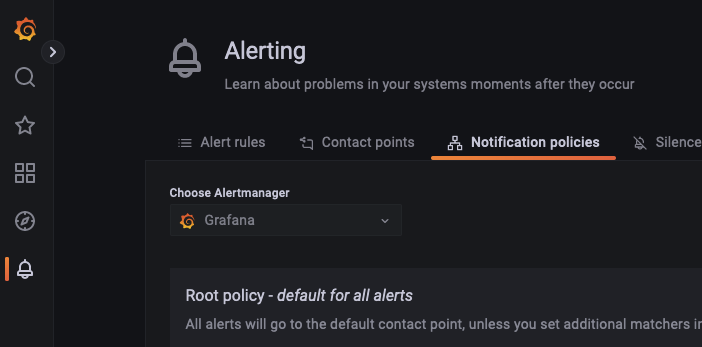
- From the Alertmanager dropdown, select an Alertmanager. By default, the Grafana Alertmanager is selected.
- To add a top level specific policy, go to the Specific routing section and click New specific policy.
- In Matching labels section, add one or more rules for matching alert labels.
- In Contact point, add the contact point to send notification to if alert matches only this specific policy and not any of the nested policies.
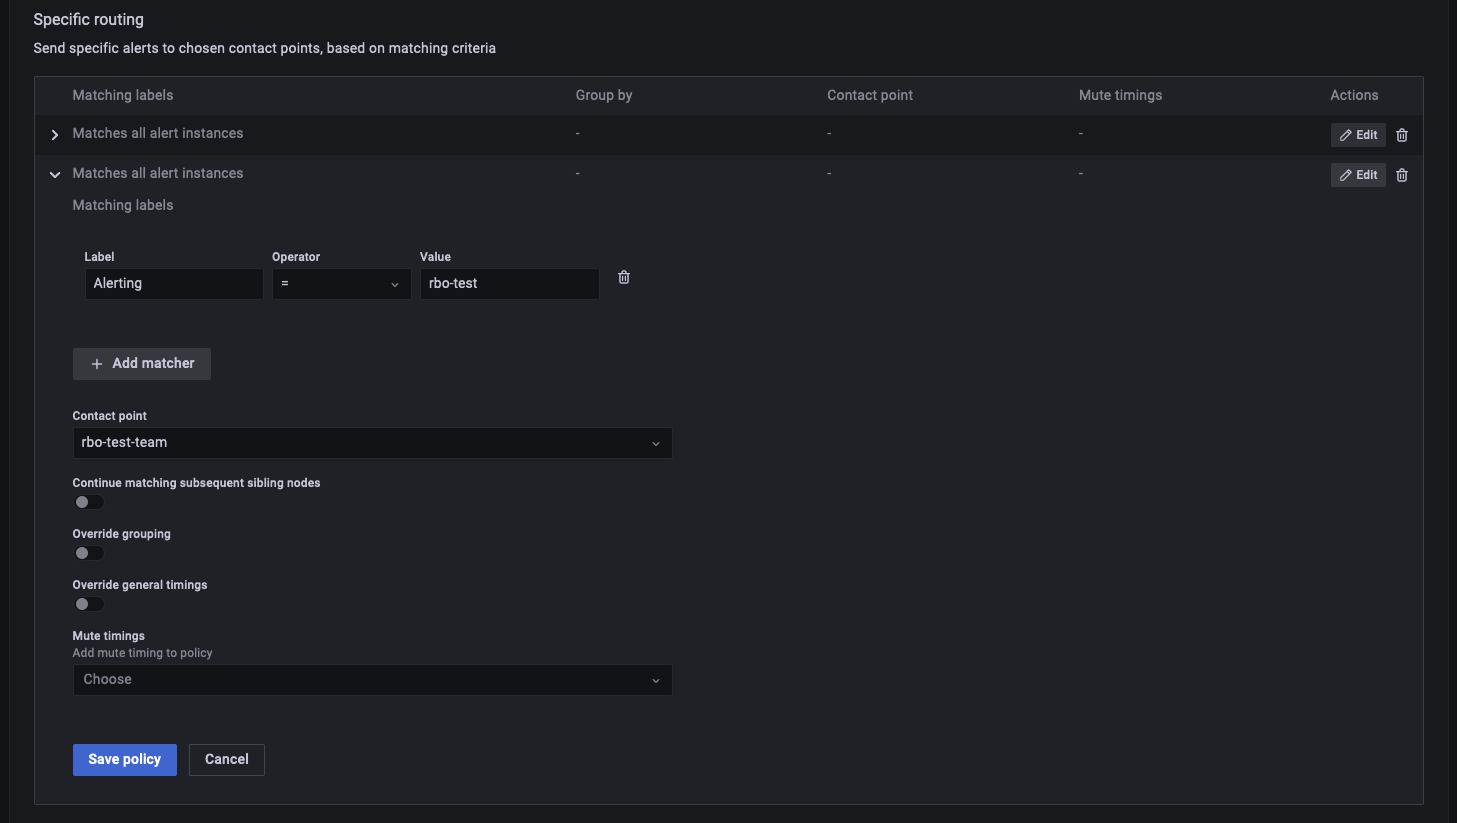
- Optionally, enable Continue matching subsequent sibling nodes to continue matching sibling policies even after the alert matched the current policy When this option is enabled, you can get more than one notification for one alert.
- Optionally, enable Override grouping to specify the same grouping as the root policy. If this option is not enabled, the root policy grouping is used.
- Optionally, enable Override general timings to override the timing options configured in the group notification policy.
- Click Save policy to save your changes.
The next section is not supported by MCS Managed Services. Due to some limitation, we are looking into adding an application to facilitate the creation and management of alerts for the customer.
Service Account over API key
Service account tokens
A service account token is a generated random string that acts as an alternative to a password when authenticating with Grafana’s HTTP API. When you create a service account, you can associate one or more access tokens with it. You can use service access tokens the same way as API Keys, for example to access Grafana HTTP API programmatically. You can create multiple tokens for the same service account. You might want to do this if:
- multiple applications use the same permissions, but you would like to audit or manage their actions separately.
- you need to rotate or replace a compromised token. Service account access tokens inherit permissions from the service account.
Service account benefits
The added benefits of service accounts to API keys include:
- Service accounts resemble Grafana users and can be enabled/disabled, granted specific permissions, and remain active until they are deleted or disabled. API keys are only valid until their expiry date.
- Service accounts can be associated with multiple tokens.
- Unlike API keys, service account tokens are not associated with a specific user, which means that applications can be authenticated even if a Grafana user is deleted.
- You can grant granular permissions to service accounts by leveraging role-based access control. For more information about permissions, refer to About users and permissions.