Azure Managed Monitoring For AKS
Introduction
As part of the continuous improvement of our Kubernetes as a Service (K8aaS) offering, we are introducing Azure Managed Prometheus and Azure Managed Grafana as new features. These additions are designed to enhance the observability and monitoring capabilities of your Azure Kubernetes Service (AKS) workloads. This service includes a shared Prometheus and Grafana instance to monitor multiple AKS clusters in a centralized and efficient manner.
By using these as managed services, you benefit from automatic scaling, high availability, and reduced operational overhead. This allows teams to focus on gaining insights from metrics, alerts and dashboards without worrying about managing the underlying systems.
Context
This documentation outlines the use of Azure Monitor Workspace (Managed Prometheus) and Azure Managed Grafana. These tools will allow you to gain deeper insights into the performance, health, and operational efficiency of your AKS clusters and applications running within them
Use case
- Monitor an SLA, a capacity planning
- Post-mortem diagnosis
- Real-time monitoring
- Create dynamic and reusable dashboards, explore metrics and logs, specify data sources, and define alerts in Grafana.
Requirements
- Minimum required Grafana role: Grafana Editor.
- This feature require much resource than baseline, successfully tested with system nodepool requirements:
vm size agent count max pod standard_B2_ms 4 30 standard_B4_ms 2 40
Getting Started
Azure managed prometheus and grafana are deployed as shared components. These component can be shared by any k8saas instance under the same tdf account Id.
Access Management
Azure Managed Grafana Roles
Our Azure Managed Grafana setup comes with three distinct roles to support different user groups. Each role is tailored to provide the necessary permissions for various tasks, ensuring appropriate access control.
| Grafana Role | Description | Key Permissions | Target Azure Group |
|---|---|---|---|
| Grafana Admin | Full administrative access to the Grafana instance. | Manage all settings, data sources, users, dashboards, and alerts. | Admins |
| Grafana Editor | Create and modify dashboards and alerts. | Create, update, and delete dashboards, configure visualizations and alerts. | DevOps Teams / Developers |
| Grafana Viewer | Read-only access to view dashboards and explore data. | View dashboards, panels, and explore data. No editing or administrative capabilities. | Other tenats that only need read access |
This role structure ensures that each user group within our Azure setup has the right access level based on their role and responsibilities.
Create and Customize Dashboards in Grafana
Navigate to azure managed Grafana
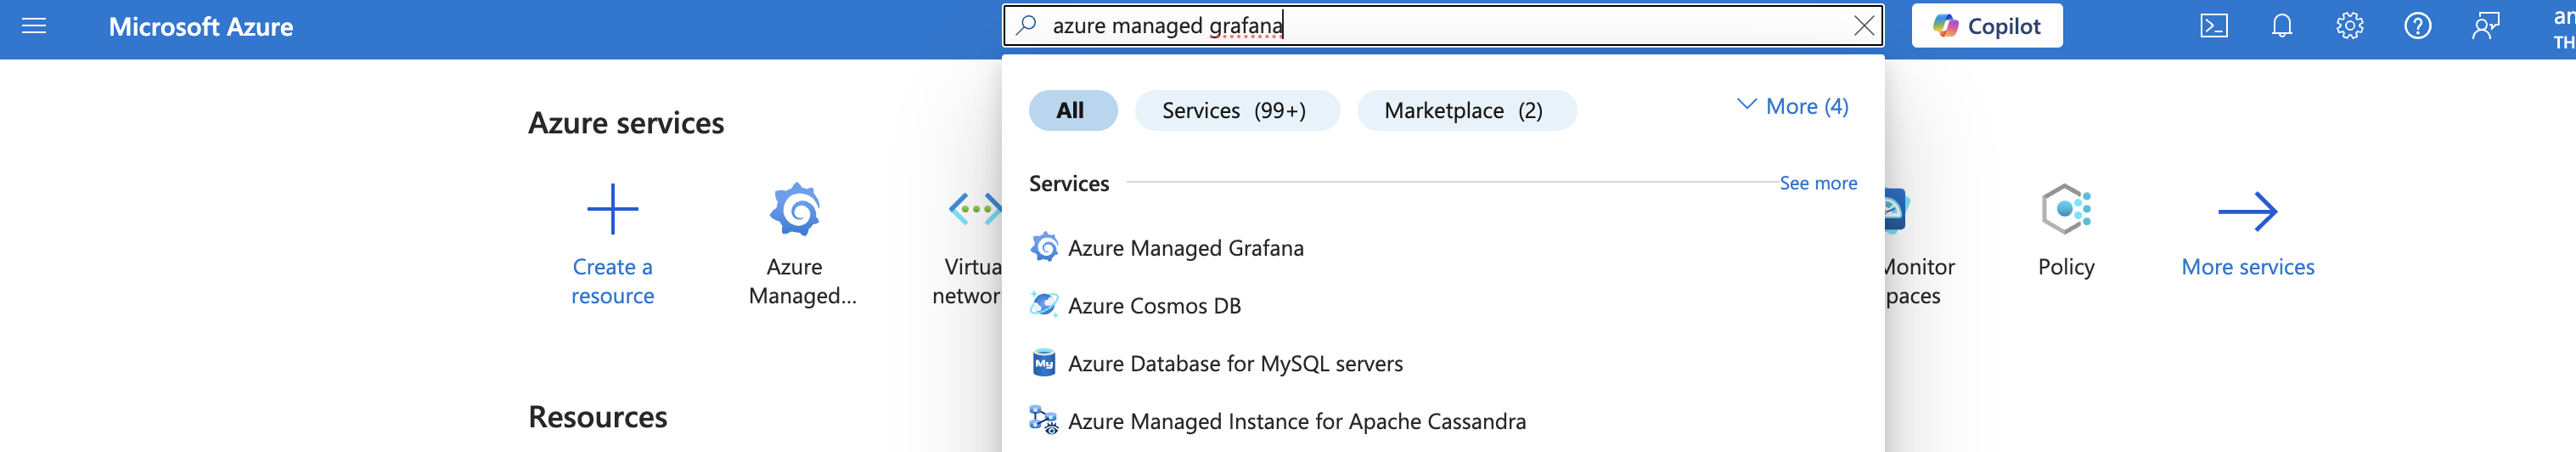
- Log in to the Azure Portal: In the search bar at the top of the portal, type "Grafana" and select Azure Managed Grafana from the dropdown list.
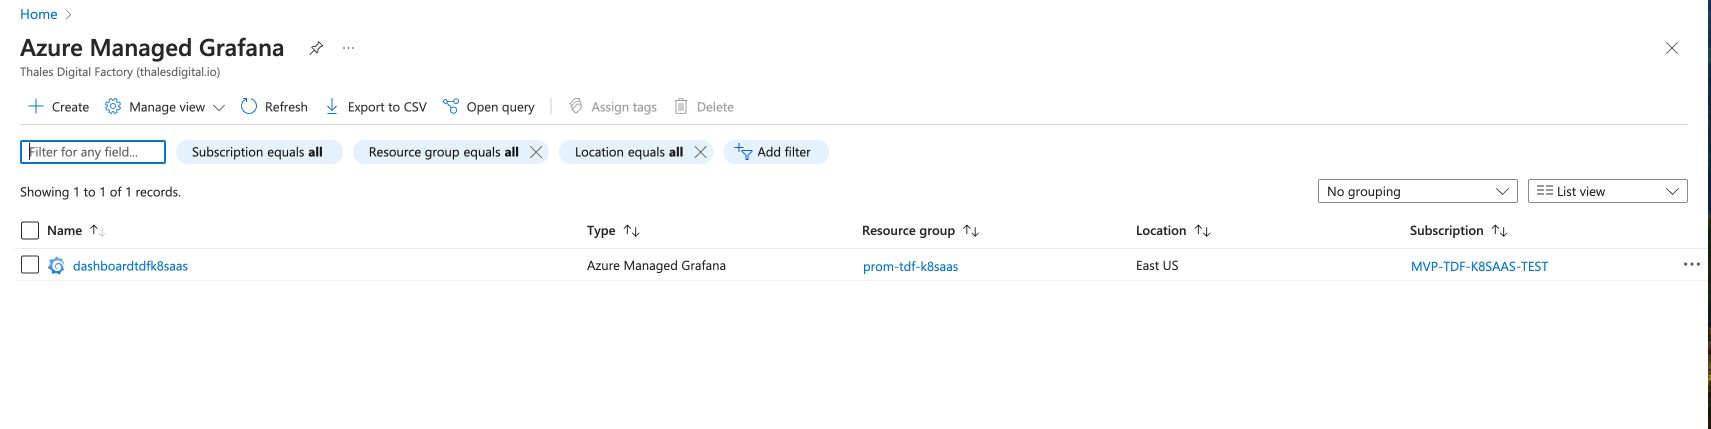
- Select Your Managed Grafana Instance: If you have one or more Azure Managed Grafana instances, you'll see a list of them. Click on the instance you want to access.
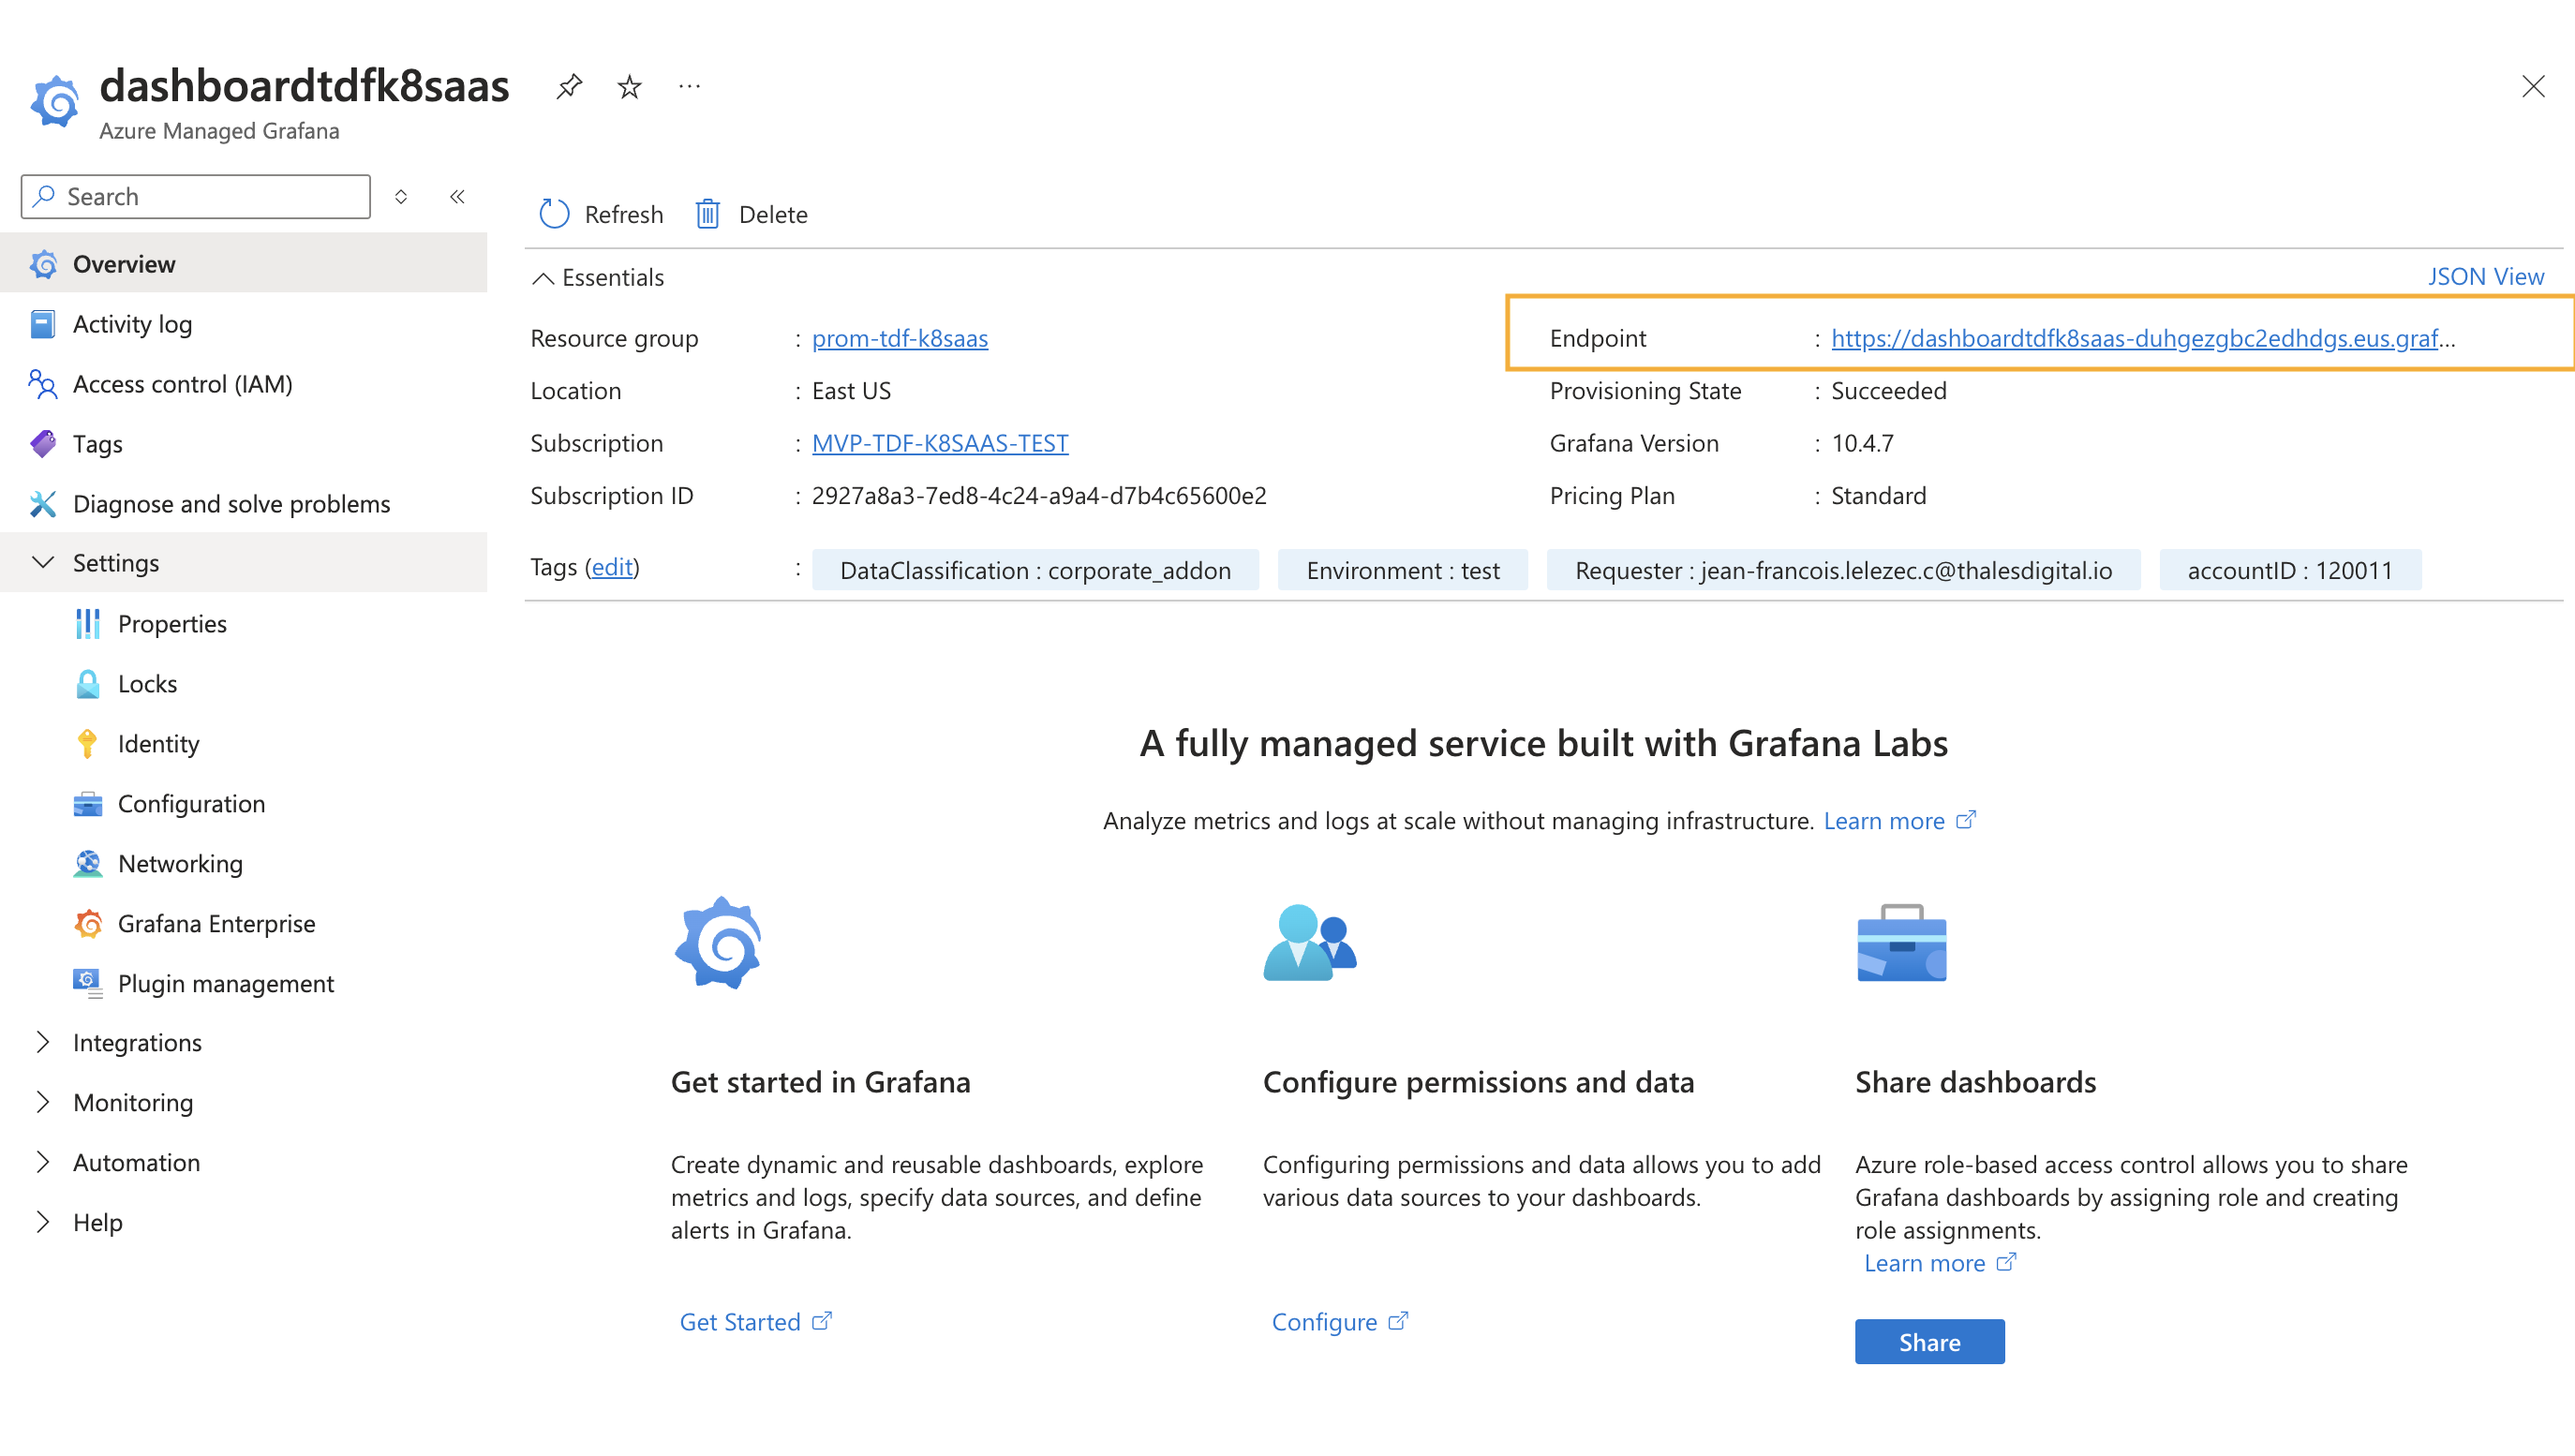
- Open the Grafana Dashboard: Once inside your Grafana instance page, click on the grafana endpoint link, which will take you to the Grafana dashboard.
Use Pre-Built Dashboards:
Grafana provides pre-built dashboards for Kubernetes and Prometheus metrics. You can import these dashboards from the Grafana Marketplace or create custom dashboards based on your needs.
The following automatically generated dashboards are available:
- Kubernetes / Compute Resources / Cluster
- Kubernetes / Compute Resources / Cluster (Windows)
- Kubernetes / Compute Resources / Namespace (Windows)
- Kubernetes / Compute Resources / Namespace (Pods)
- Kubernetes / Compute Resources / Namespace (Workloads)
- Kubernetes / Compute Resources / Node (Pods)
- Kubernetes / Compute Resources / Pod
- Kubernetes / Compute Resources / Pod (Windows)
- Kubernetes / Compute Resources / Workload
- Kubernetes / Kubelet
- Kubernetes / Networking
- Kubernetes / USE Method / Cluster (Windows)
- Kubernetes / USE Method / Node (Windows)
- Node Exporter / Nodes
- Node Exporter / USE Method / Node
Import existing Dashboard
Access to the import Dashboard option
-
In the left-side navigation pane of Grafana, click on "Dashboards".
-
In the top-right corner of the Dashboards page, click the "New" then "Import" button
-
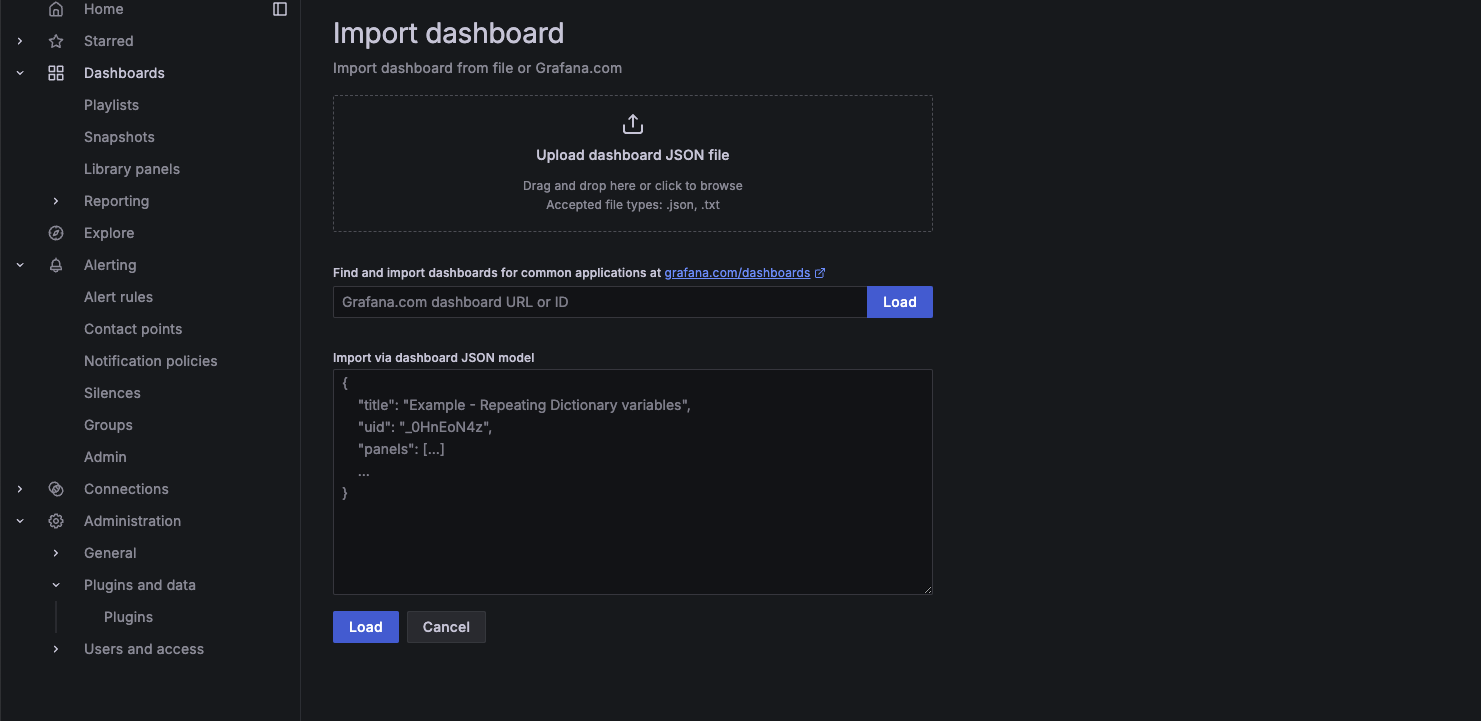
Provide the Dashboard Information: You have two options to import a dashboard
Option 1: Import by Dashboard ID or URL: Enter the Dashboard ID or URL of a shared Grafana dashboard from Grafana.com. Click "Load" to fetch the dashboard details. Option 2: Import from a JSON file: Click the "Upload JSON file" button if you have a .json file of the dashboard configuration. Select the JSON file from your computer and upload it.
-
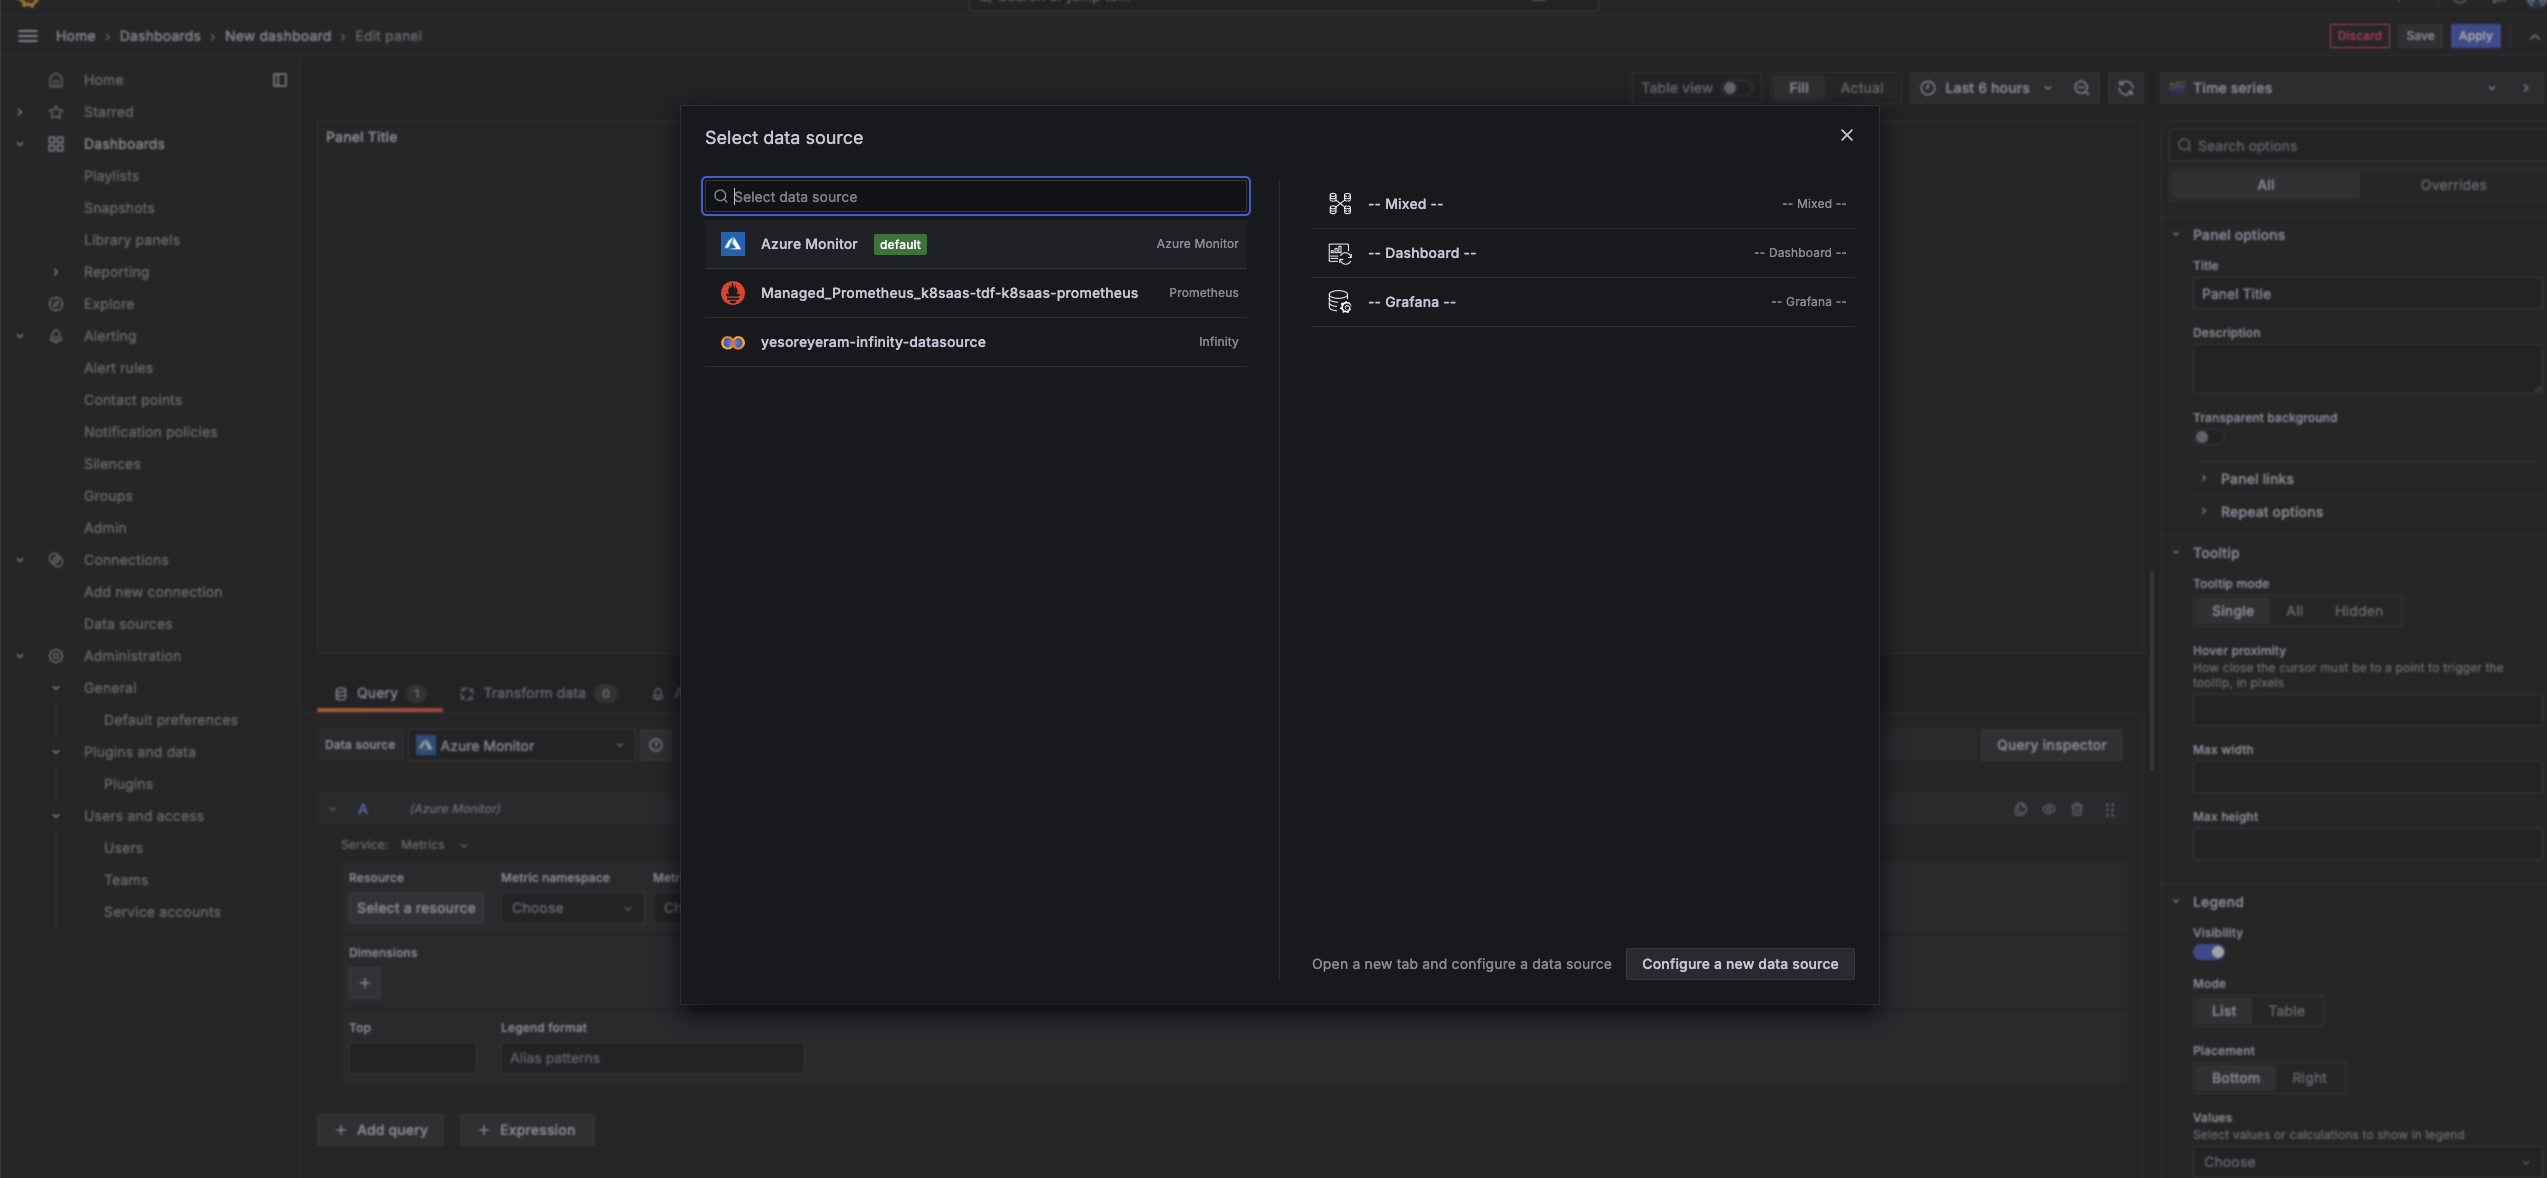
Configure Data Sources: After loading the dashboard, Grafana will ask you to configure data sources. Select the appropriate data source from the dropdown list (e.g., Azure Monitor, Managed_Prometheus_XXXx). Click "Import" to complete the process.
Create Custom Dashboards:
To create a custom dashboard:
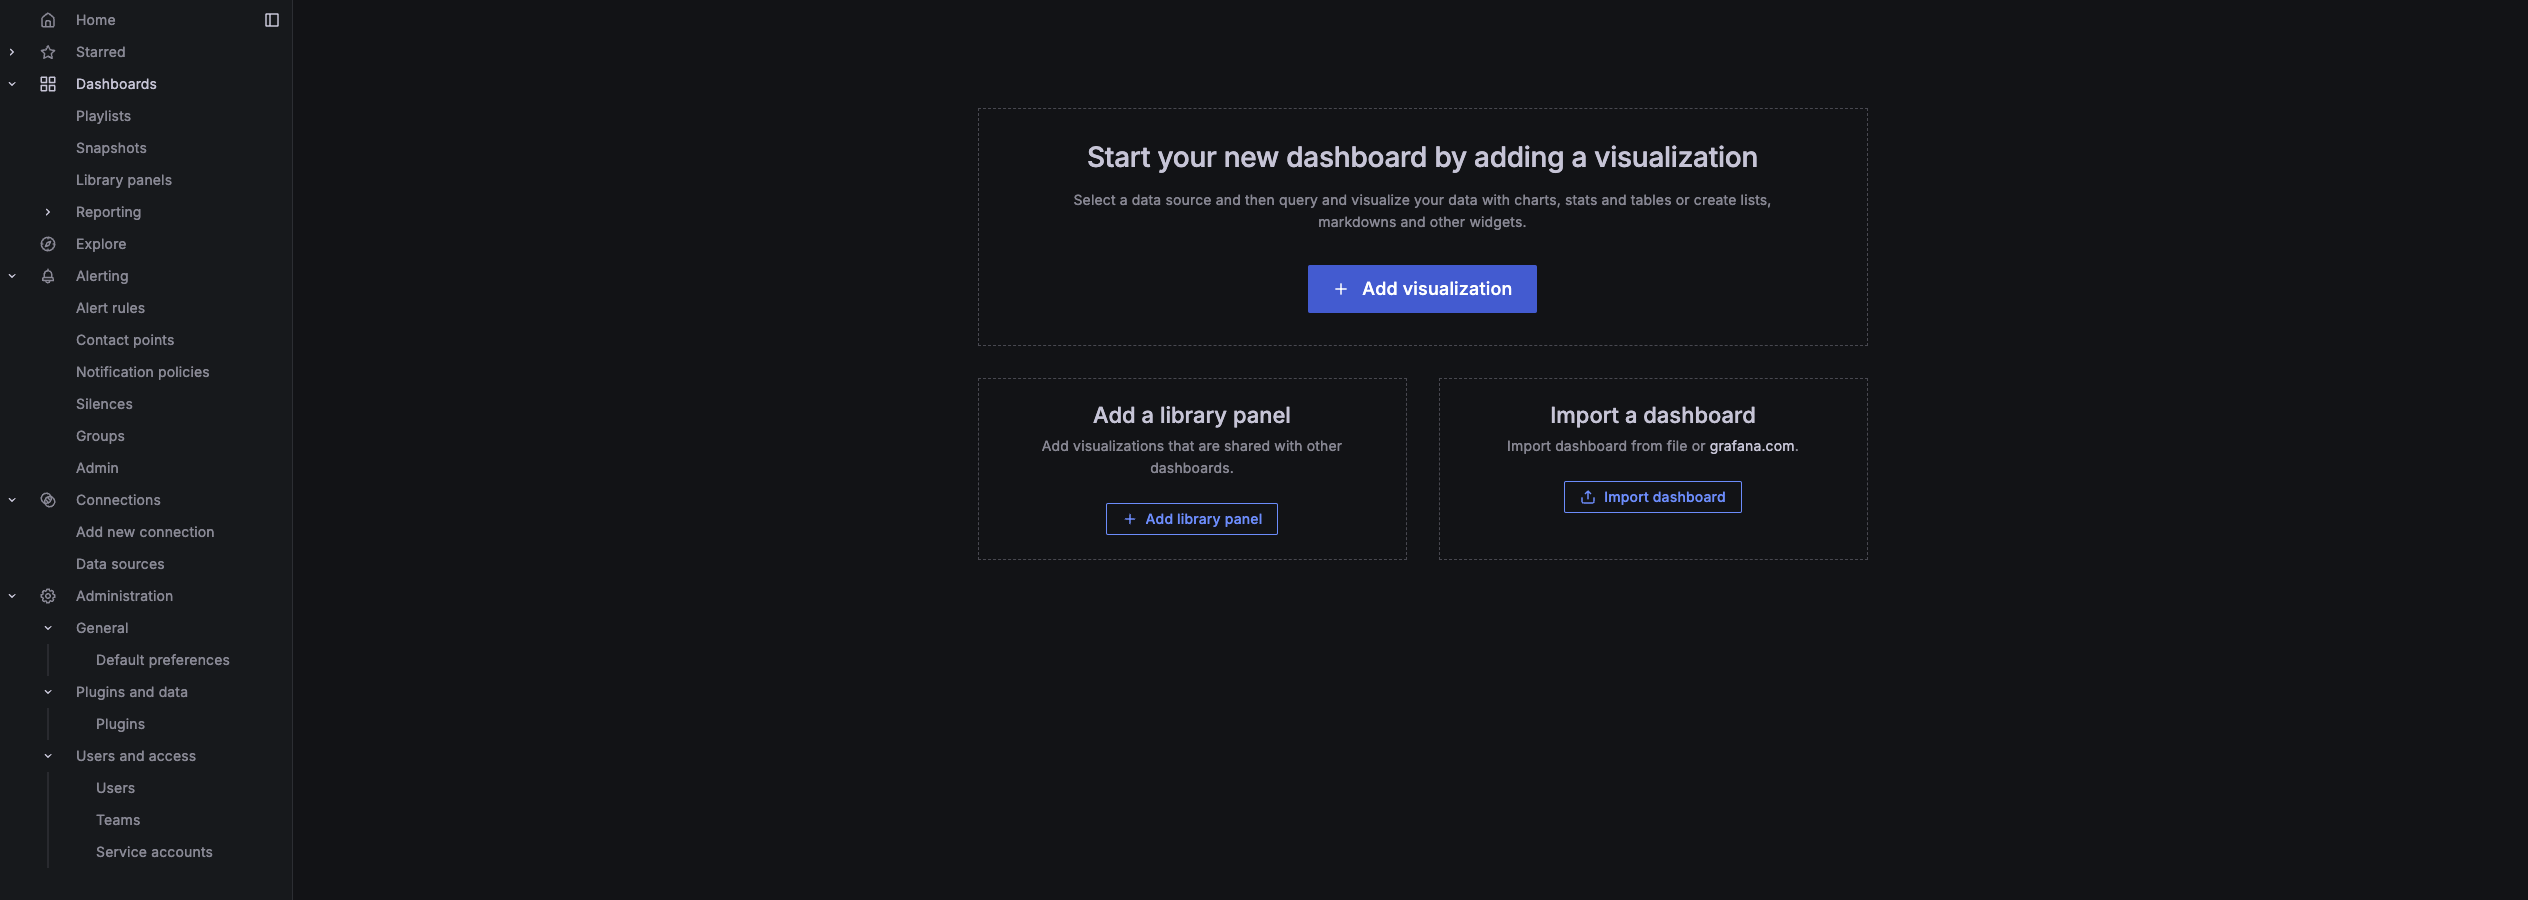
- In the left-side navigation pane of Grafana, click on "Dashboards".
- In the top-right corner of the Dashboards page, click the "New" then "New Dashboard" button
Choose Add + Add visualization, and use the Azure Monitor or Prometheus data sources to query the metrics you want to visualize (e.g., CPU usage, memory usage, pod restarts, request latencies).
Adjust the panel settings for visualization (graphs, tables, heatmaps, etc.).
- Save the Dashboard:
Once your panels are configured, click Save Dashboard, and assign it a name. You can now view real-time metrics and historical data of your AKS cluster on your Grafana dashboard.
Setting Grafana Alerting
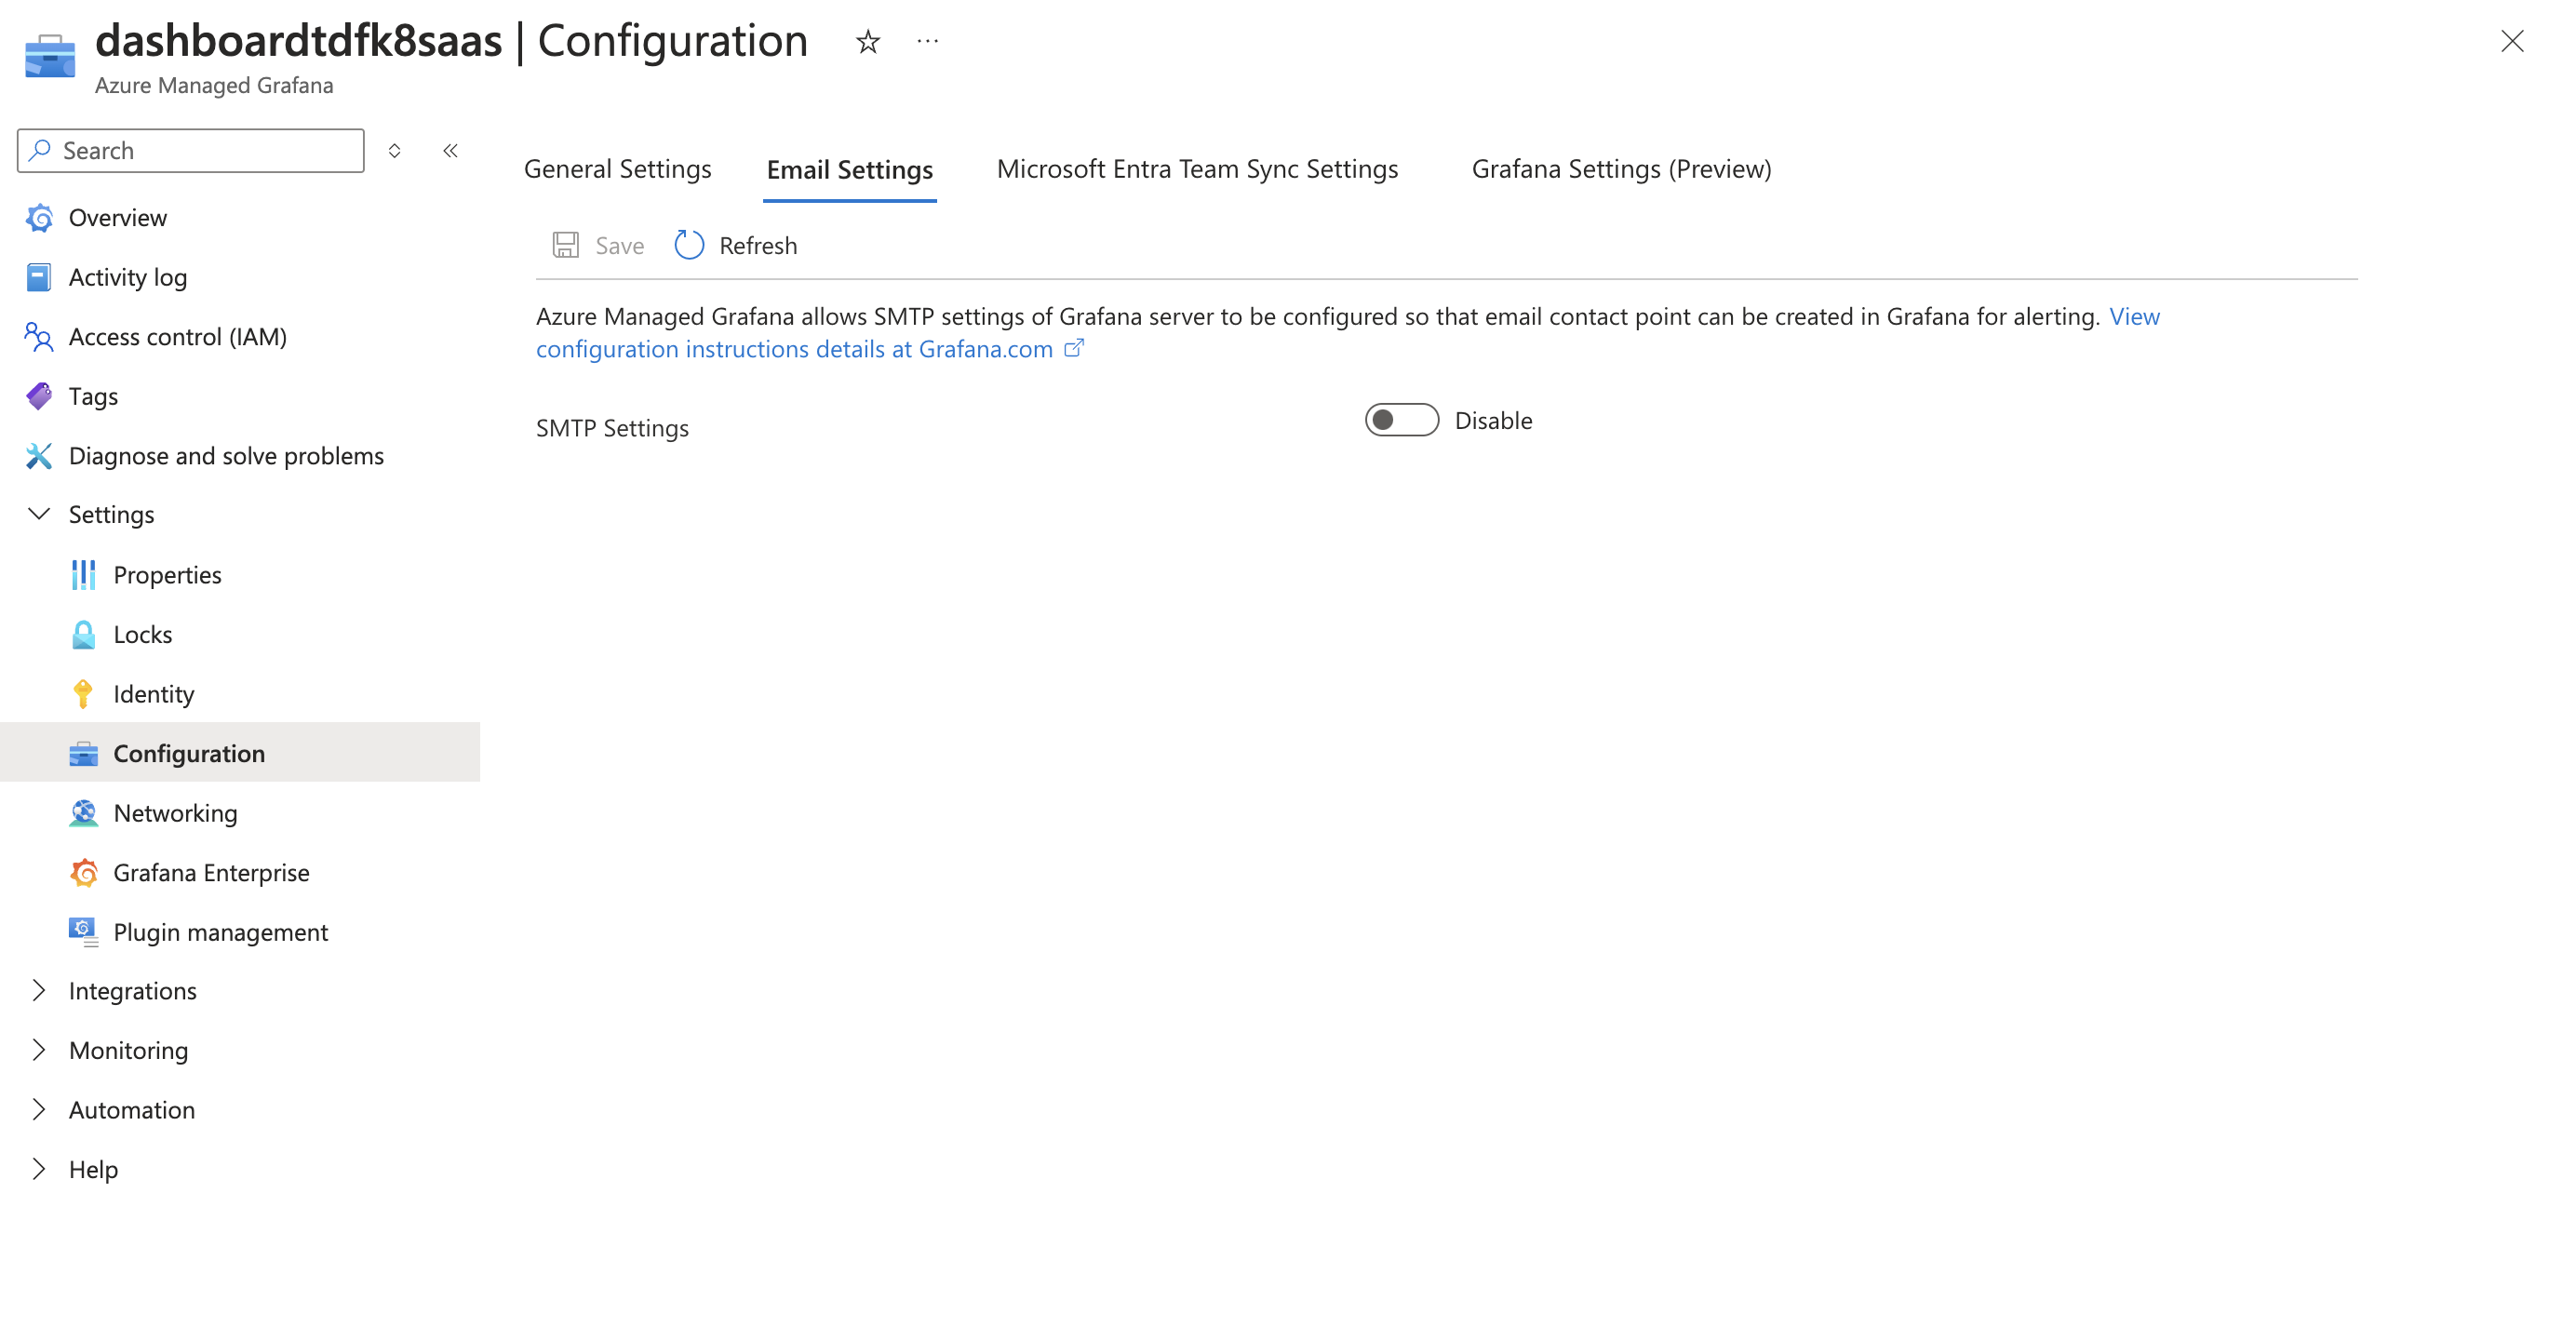
Step 1: Access the Azure Managed Grafana Instance and Configure SMTP Settings
In the Settings section, look for Configuration then Email settings.
Enable the SMTP settings
Input the following required SMTP details:
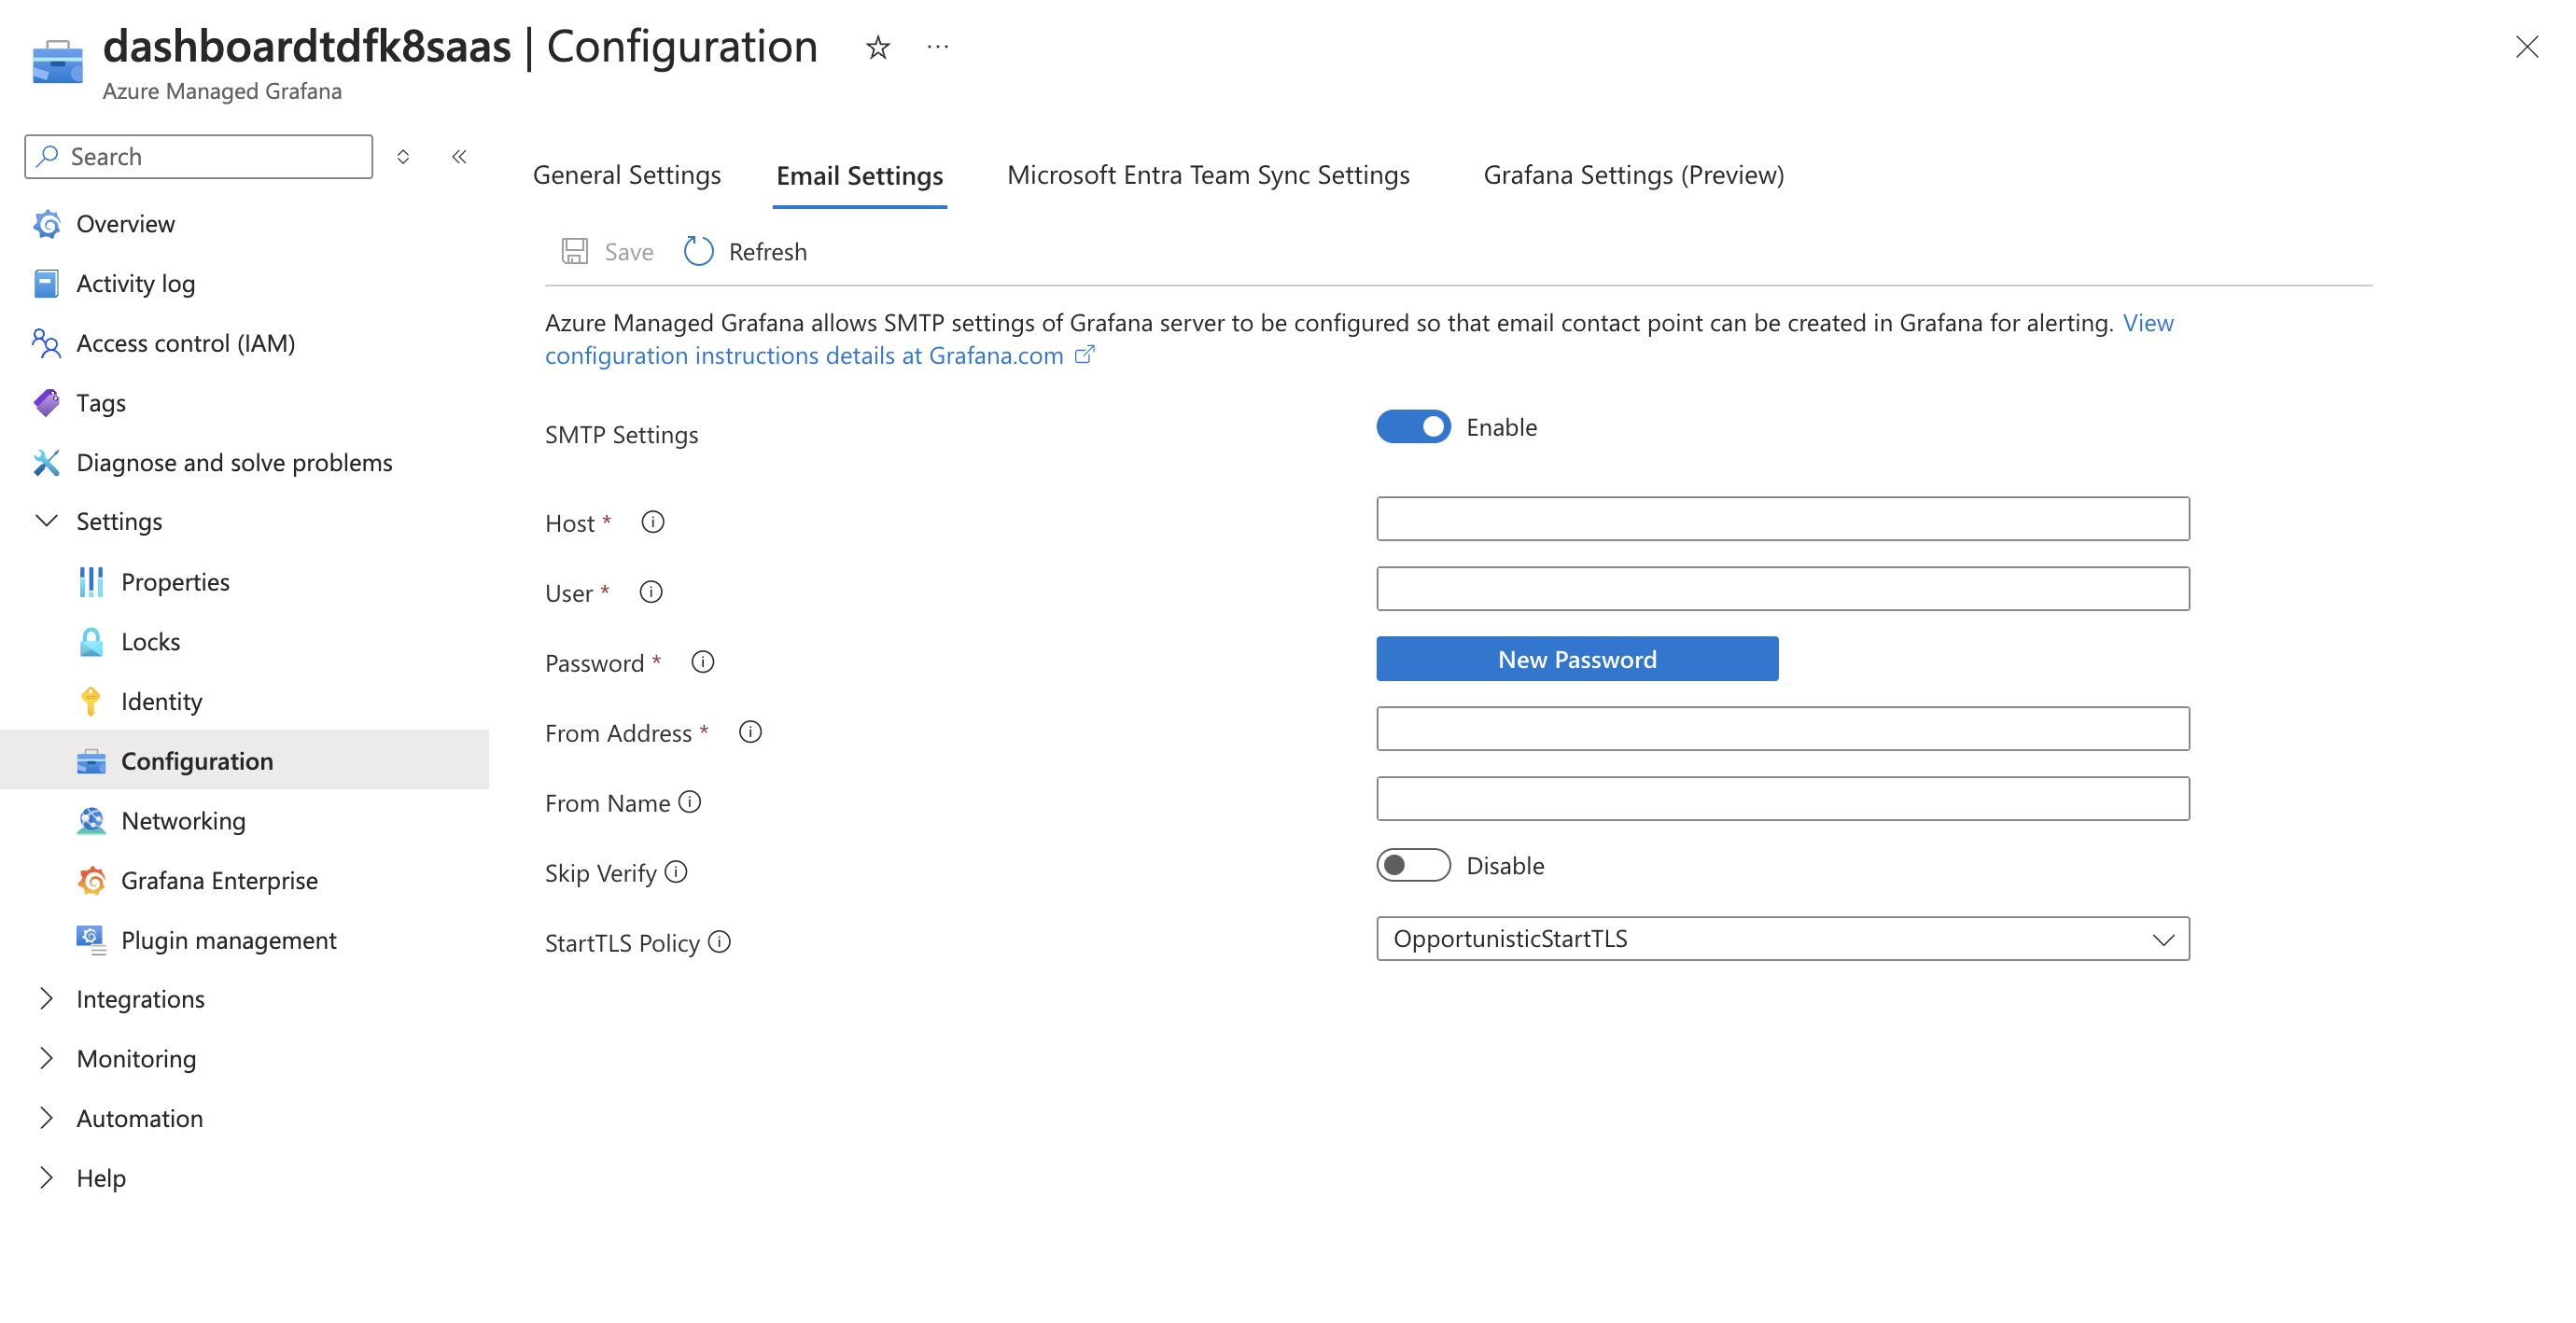
- Host: Port: The address and Port of your SMTP server
- User: Your email address or the username for the SMTP server.
- Password: The password or App-specific password for the SMTP user.
- From Address: The email address that will appear as the sender.
- From Name: The name that will used when sending out emails.
- Skip Verify: Enable or disable ssl verification based on your SMTP provider’s requirements.
Step 2: Save and Test the Configuration
After entering the SMTP details, save the configuration. Test the configuration by sending a test email from within Grafana.
-
Go to Alerting
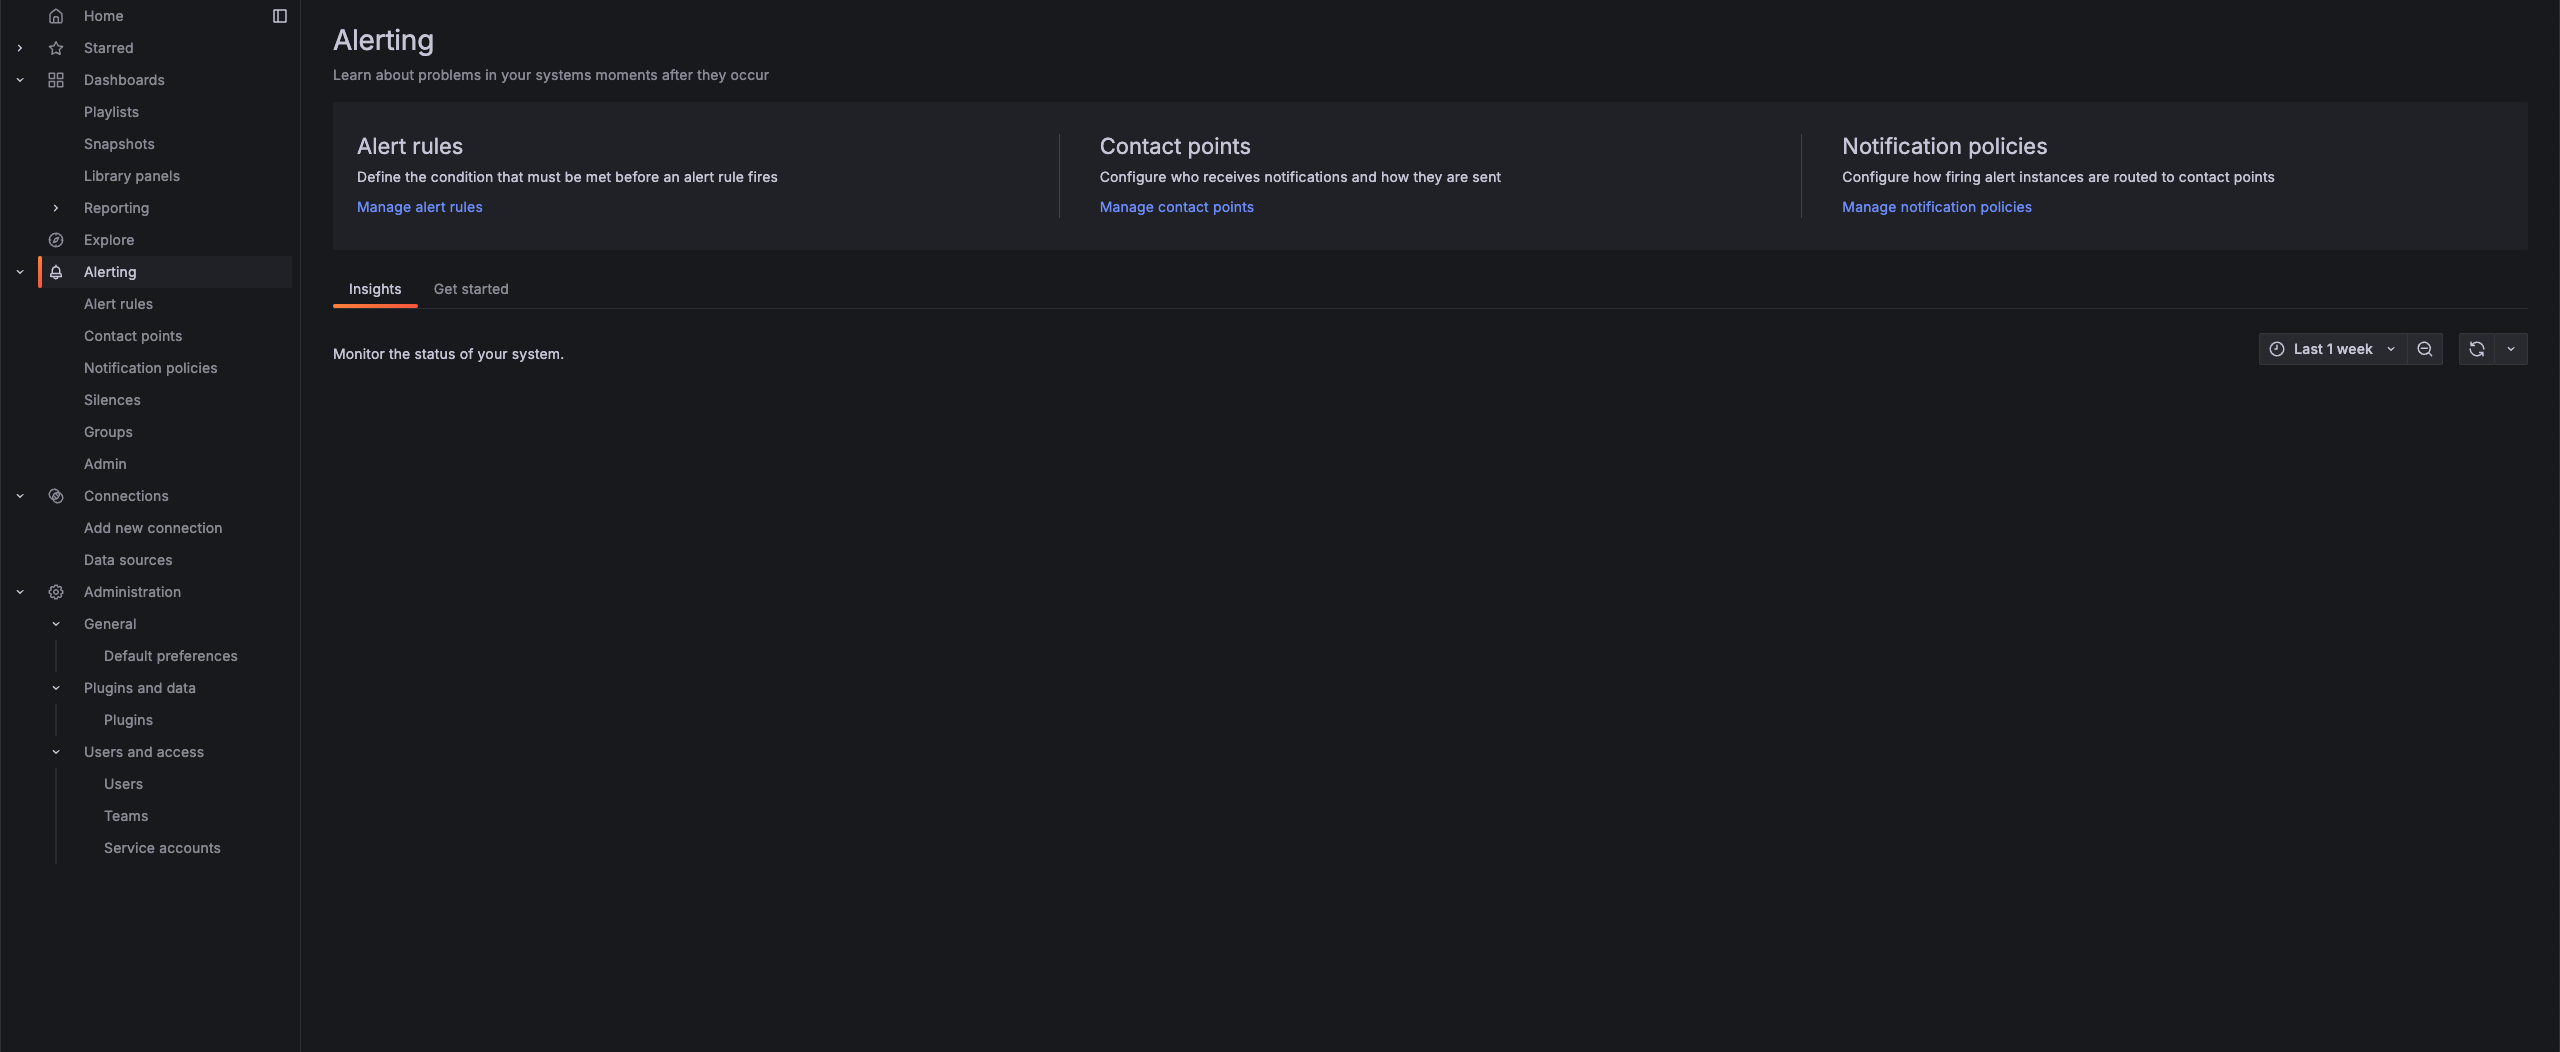
-
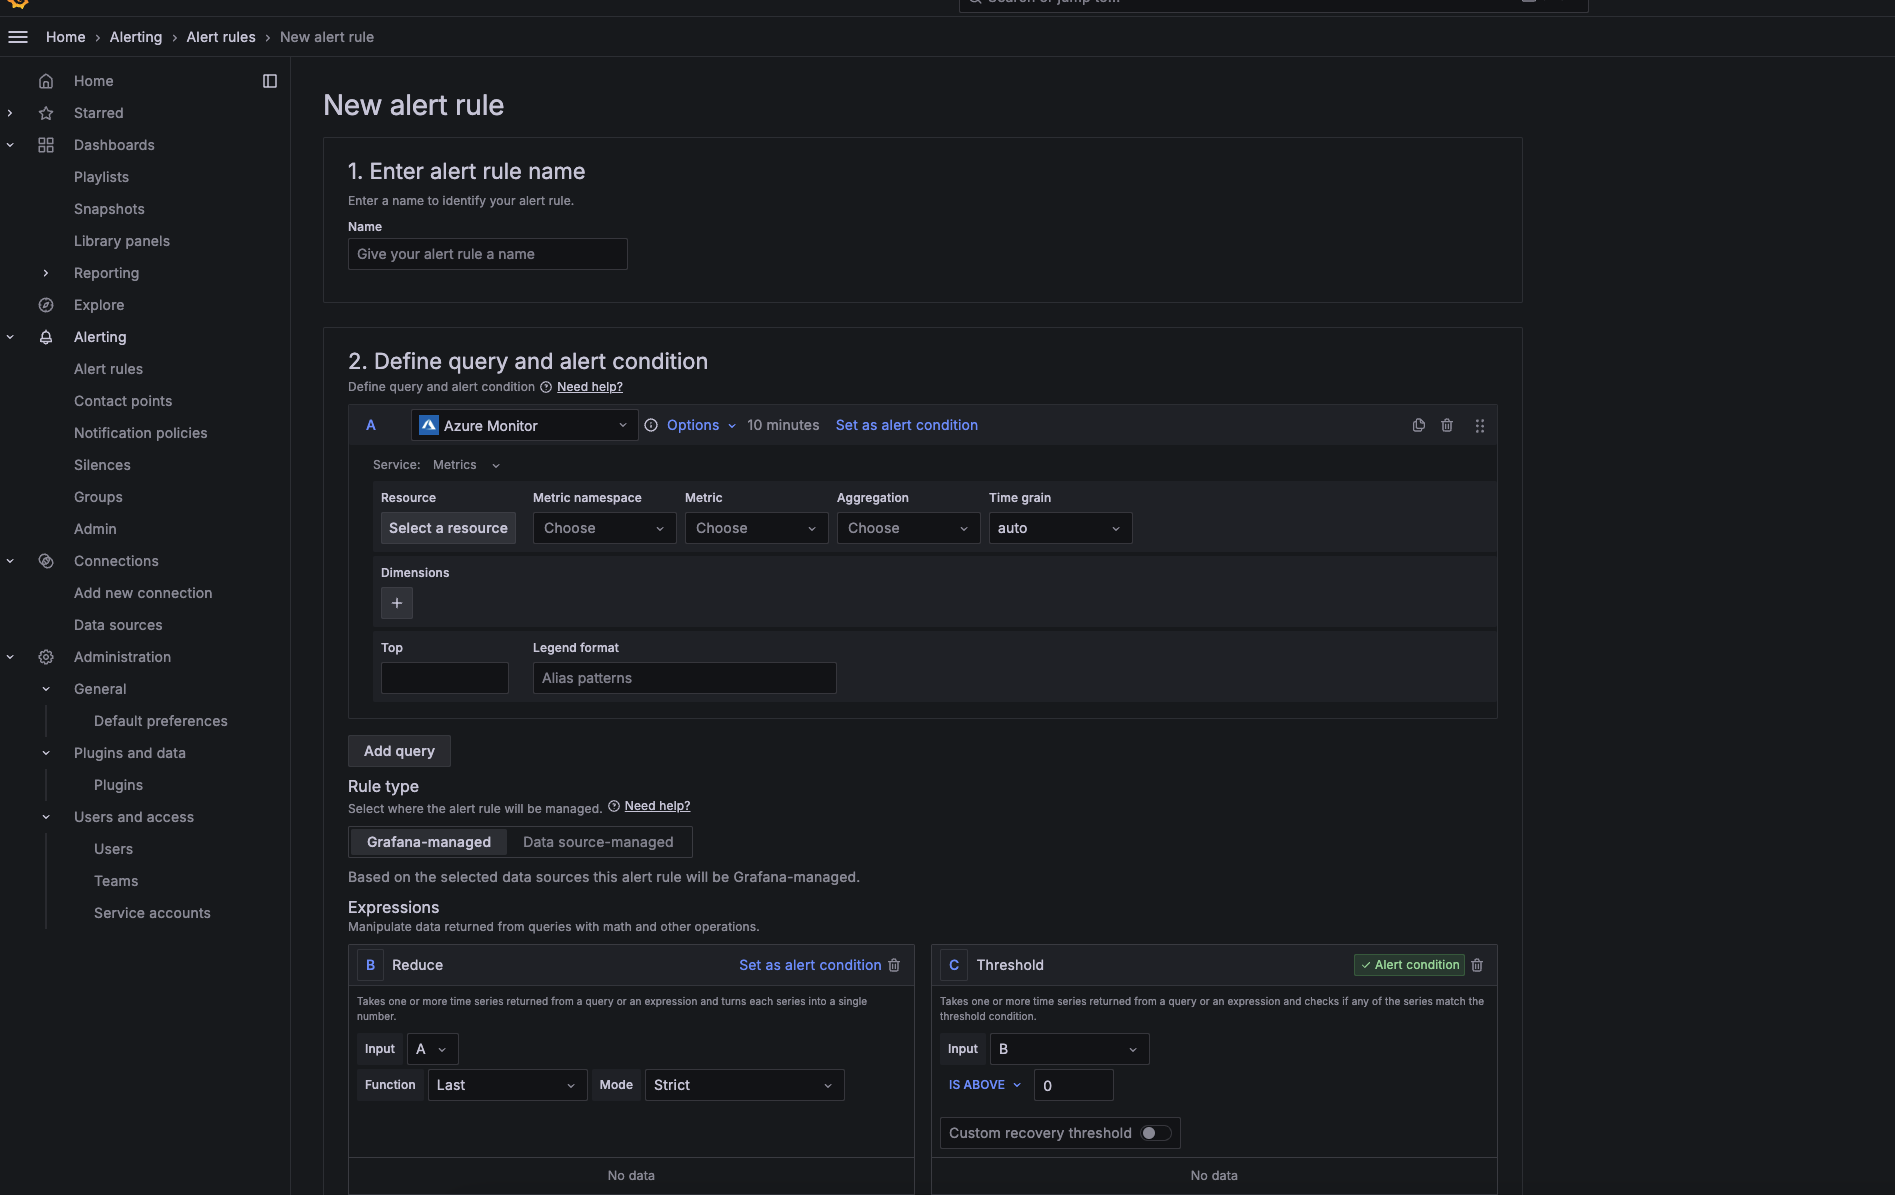
Create Alert rule and define your alert condition
-
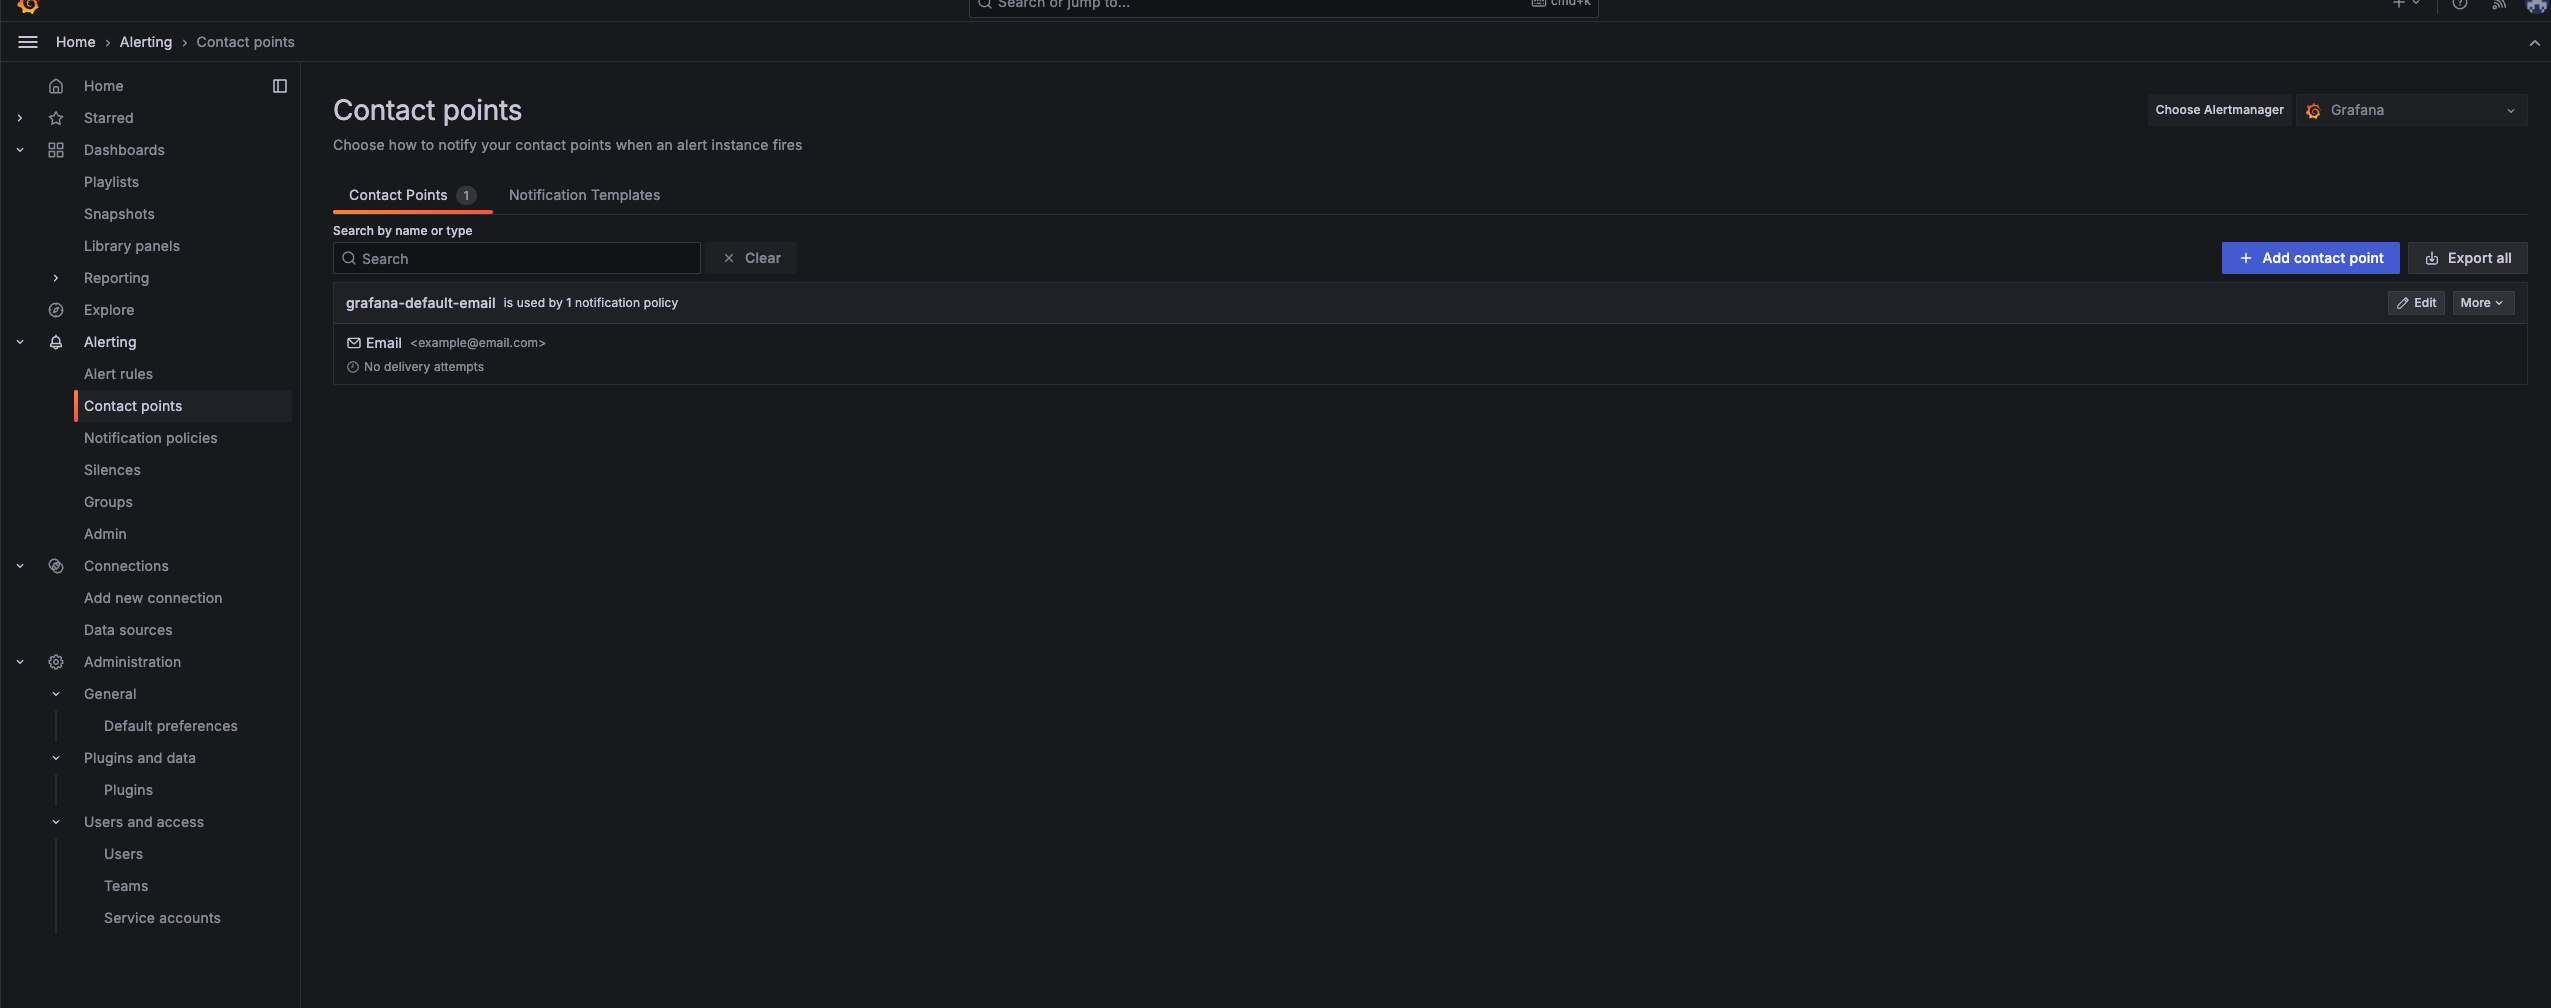
Create Contact Point to create or manage notification channels (e.g., email, Slack, webhooks).
- Trigger a test alert to confirm the SMTP configuration is working properly After defining the alert, choose the appropriate contact point for sending notifications.
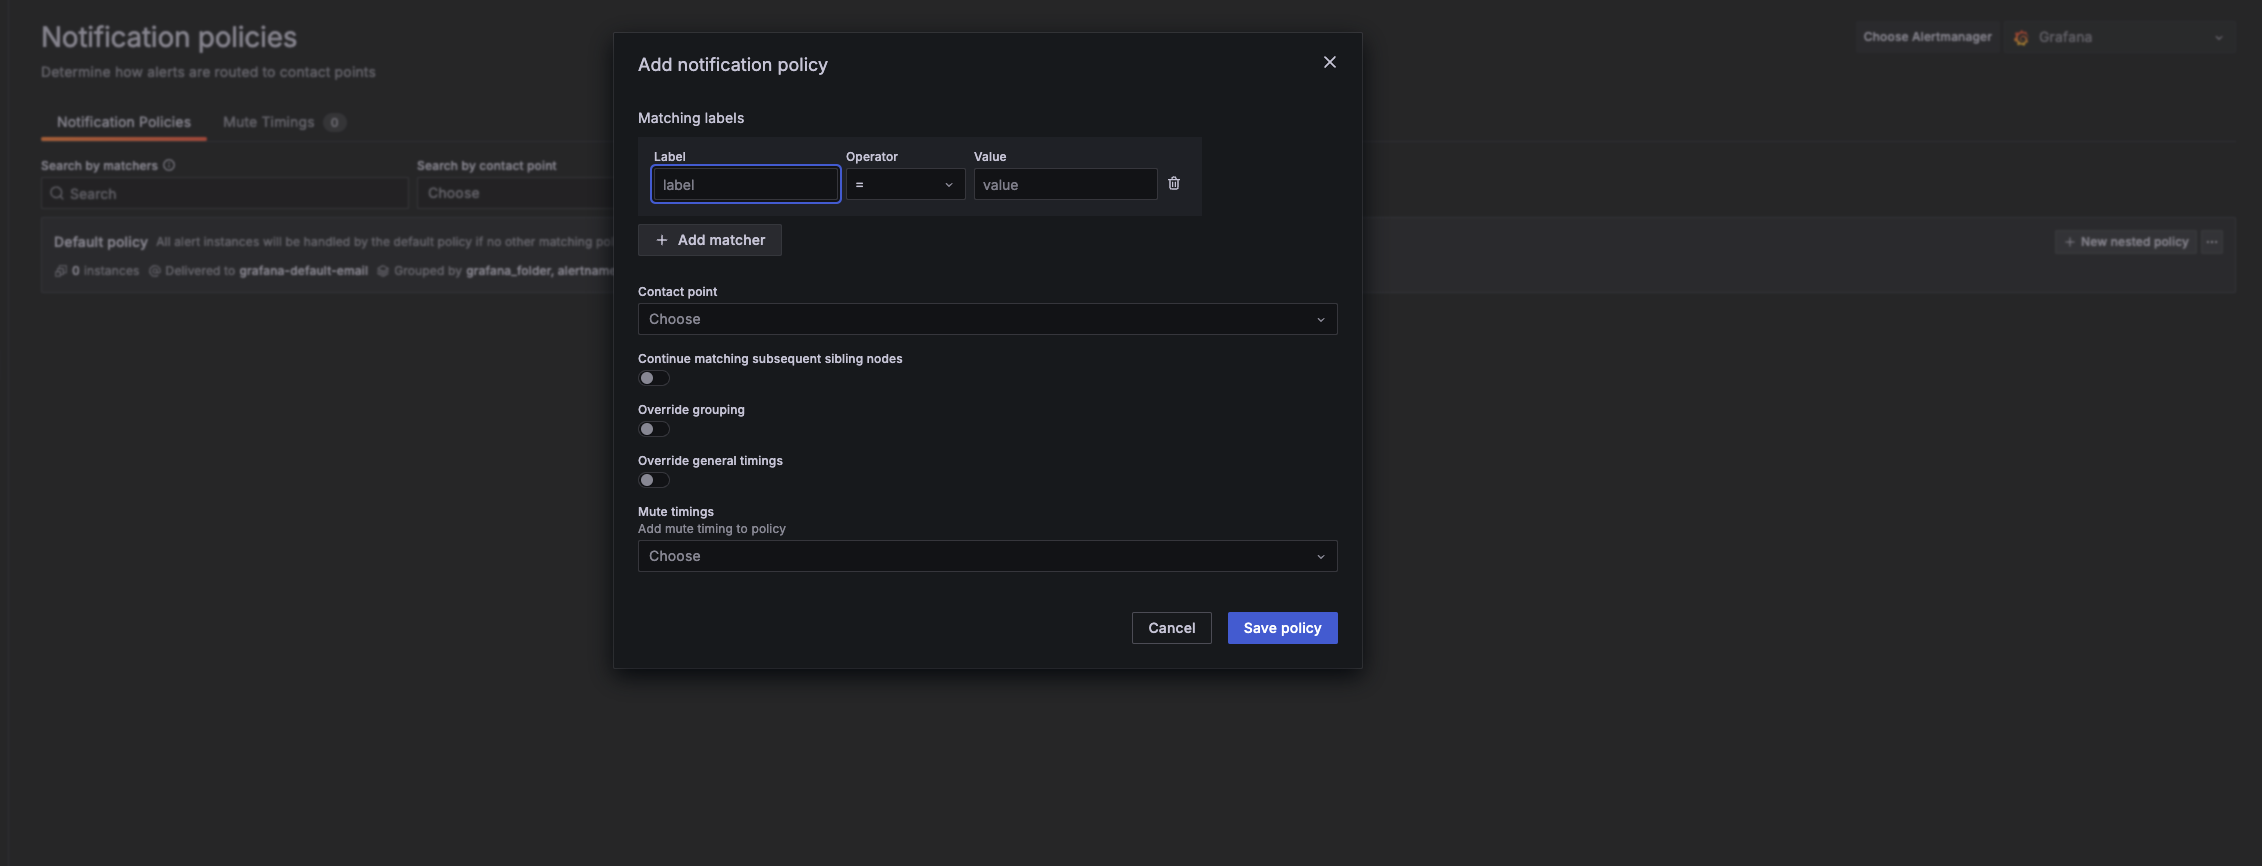
If needed, go to Alerting > Notification policies to manage escalation paths, grouping, or silencing notifications.
Managed Grafana resources as code (Terraform)
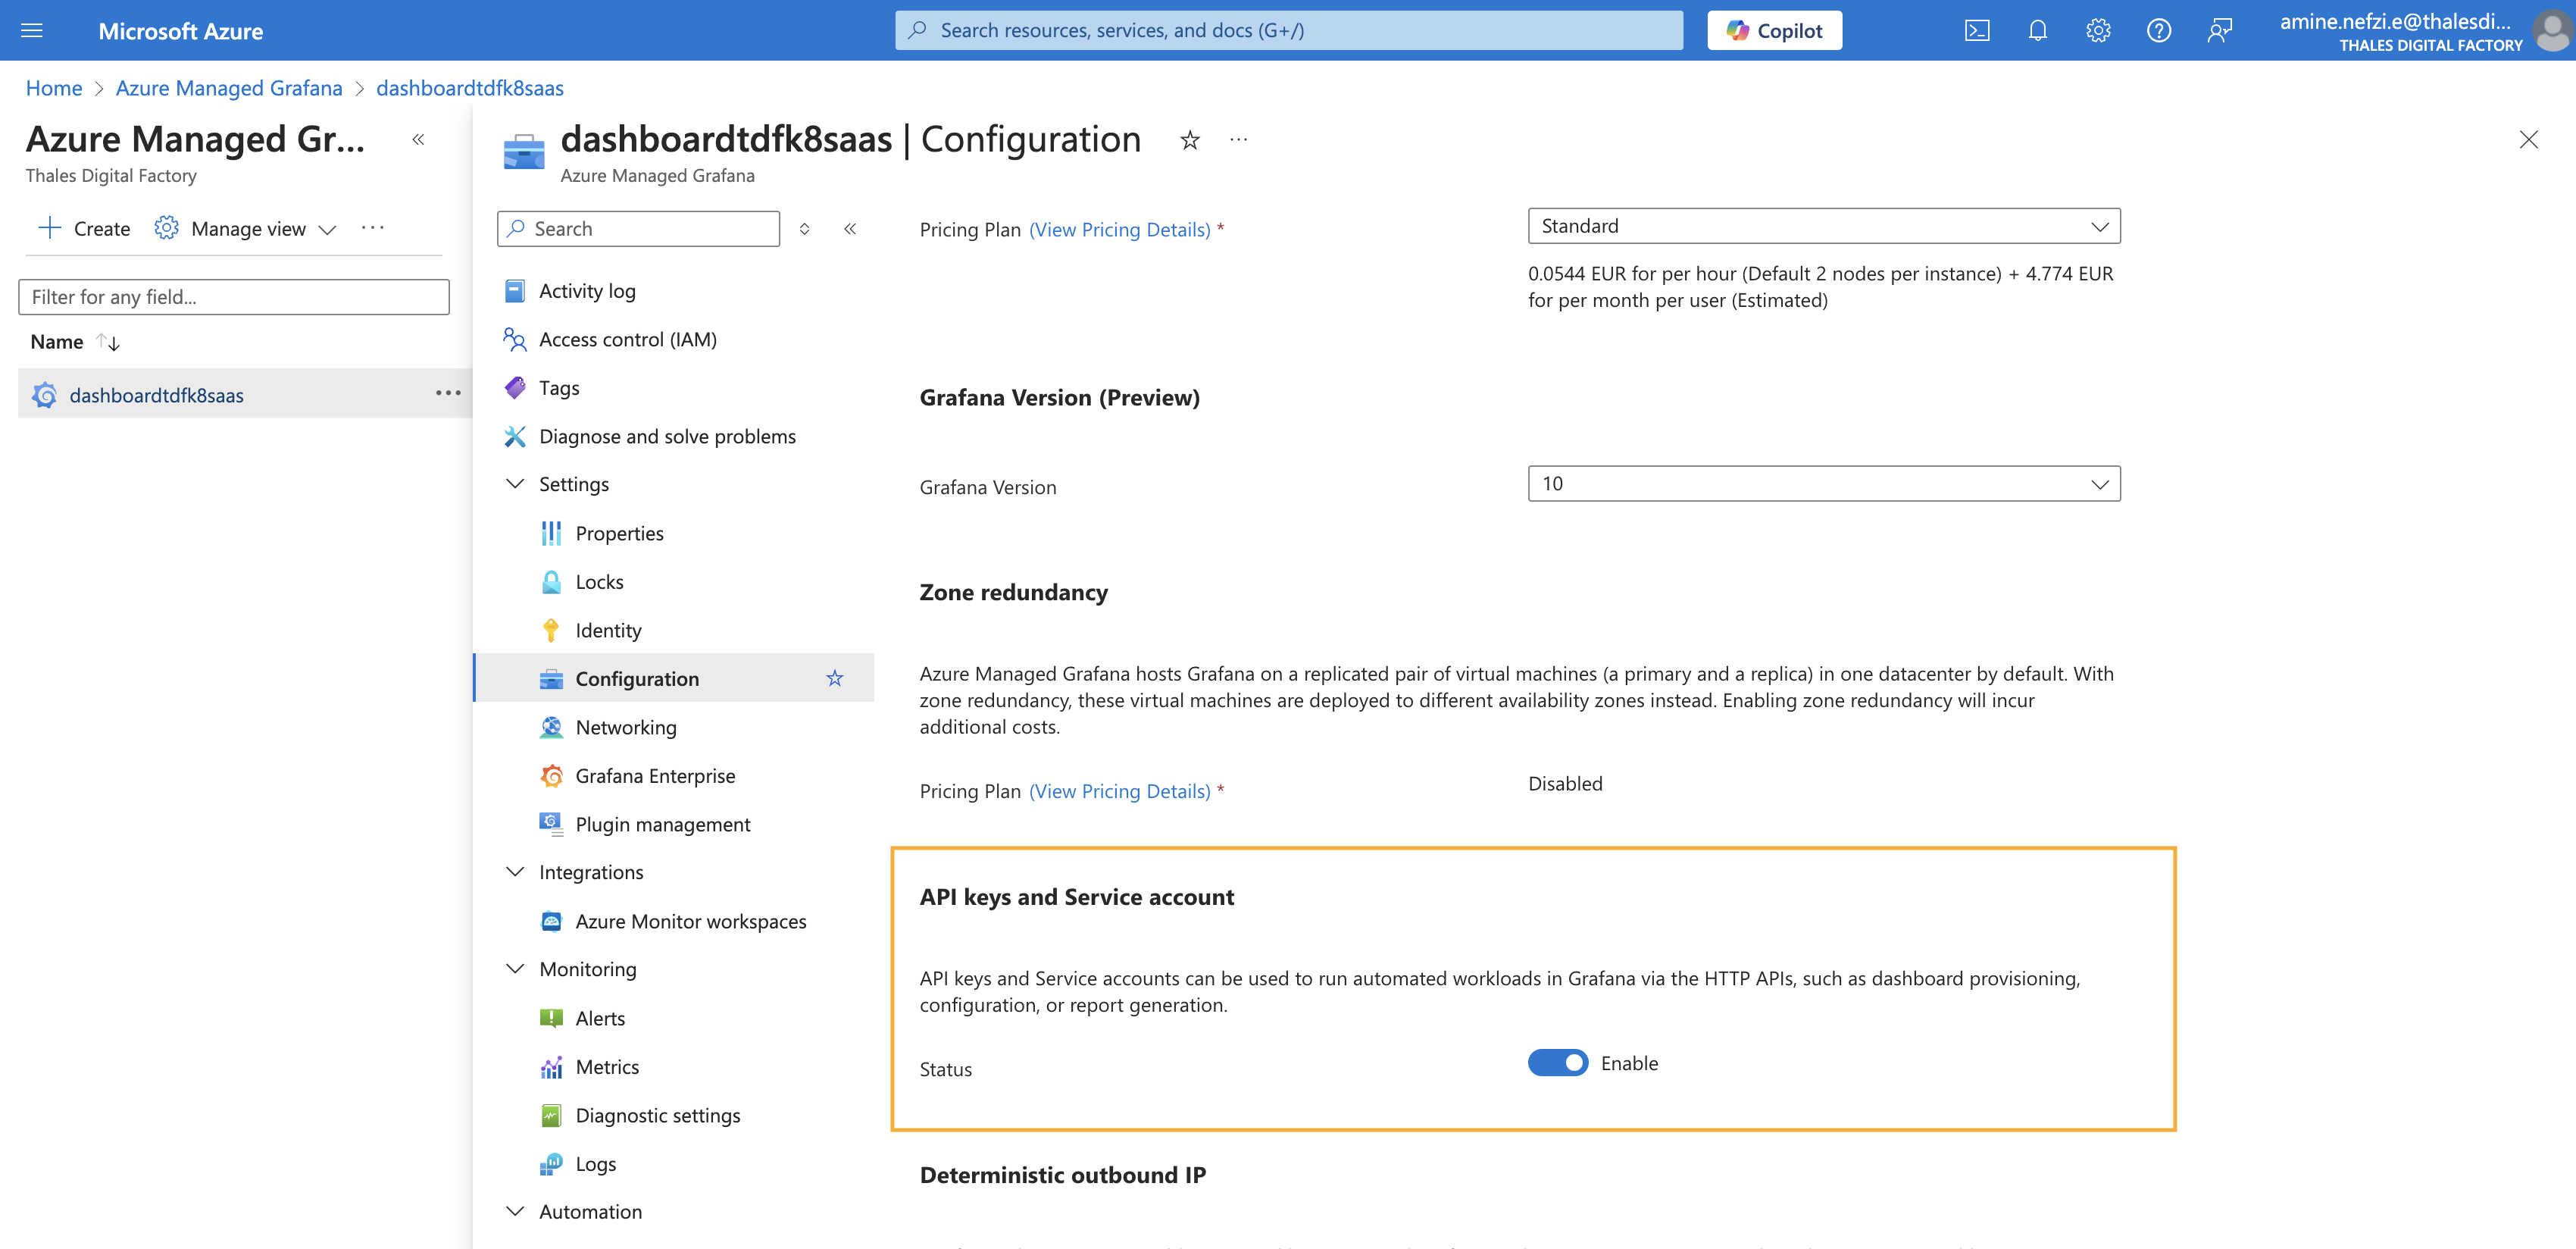
- Ensure that the API keys and Service account feature is enabled
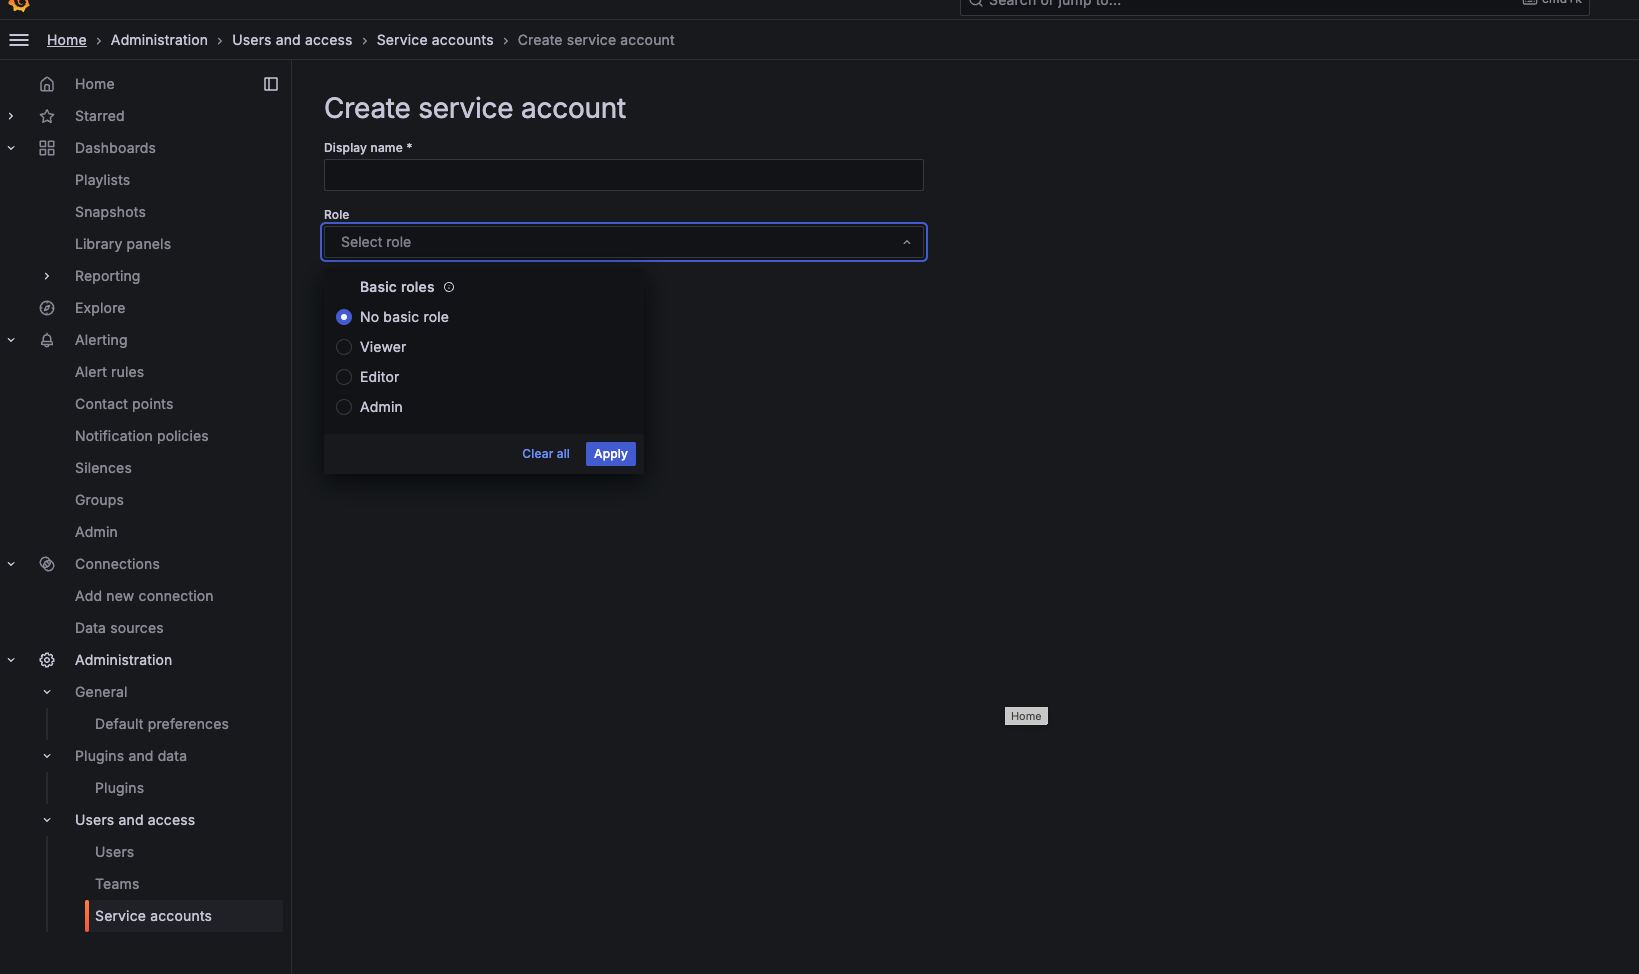
- Create a grafana service account
- Login to grafana dashboard
- Go to Administration/Users and access/Service accounts
- on the top right section click Add service account and create one with Editor persmission for managing dashboards and admin permission to manage dashboards and alerts.
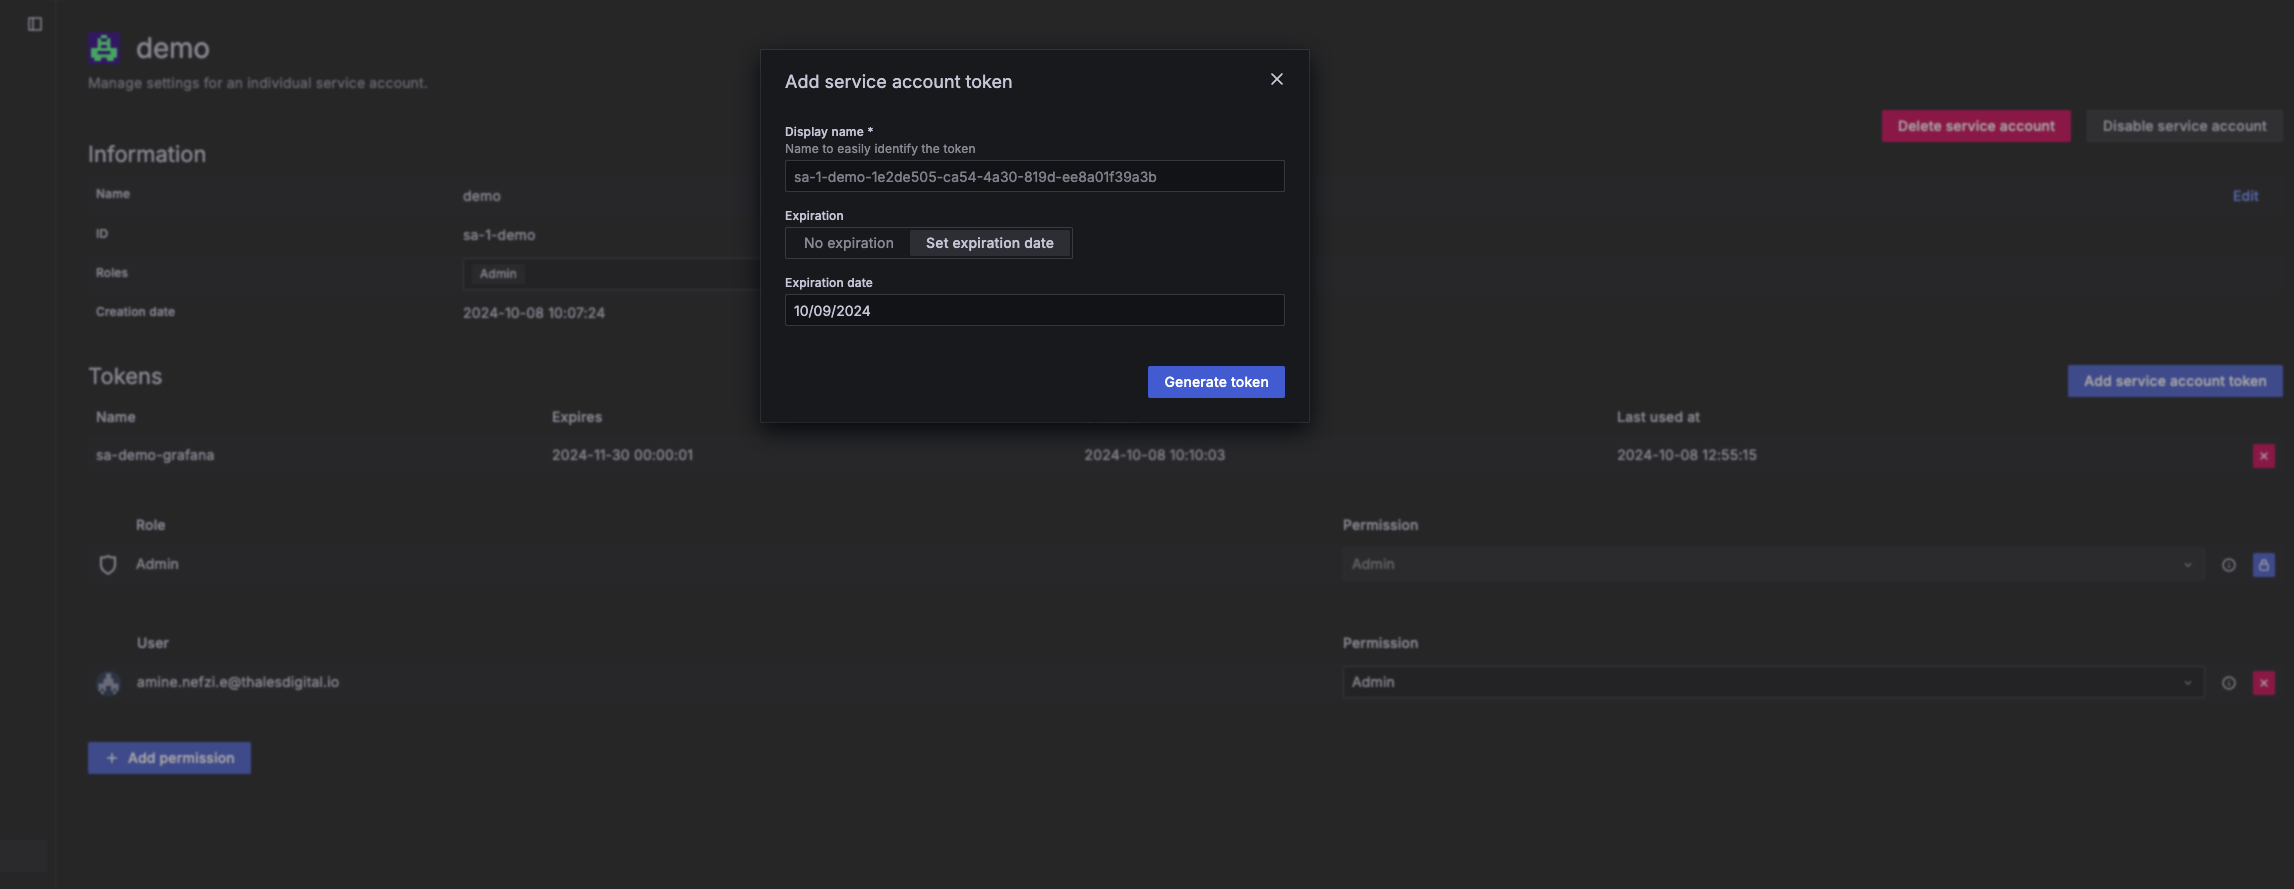
- Create a token under the service account and save it
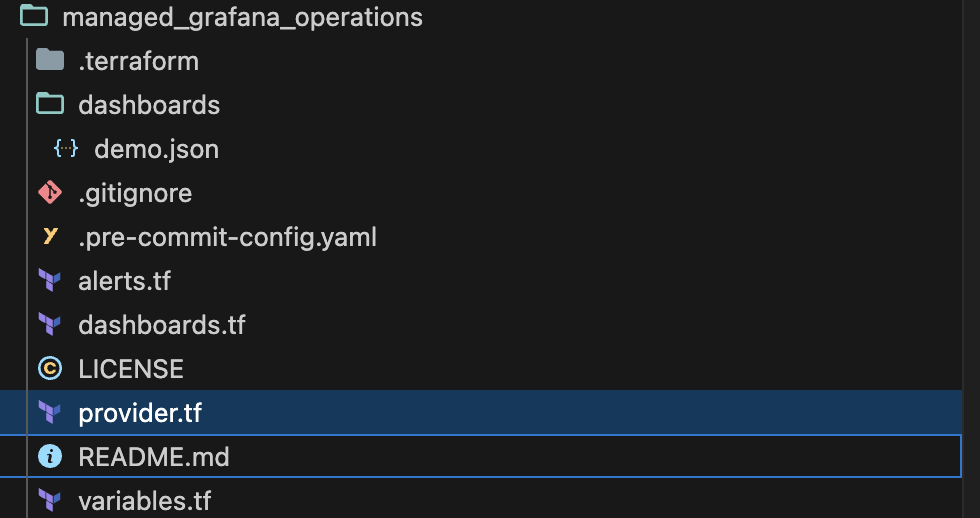
- Dashboards resources
- Alerts resources
- variables
- providers
- terraform version
- Create a folder to hold all you json dashboards (in this example we call it dashboards)
- Create a resource for each dashboard and refer config_json to the appropriate json file
resource "grafana_dashboard" "demo_node_dashboard" {
  config_json = file("dashboards/demo.json")
  overwrite = true
}
in this example we will create :
-
Alert Group: A logical grouping of alert rules.
-
Contact Point: A destination for alert notifications (e.g., email, Slack, webhook). This determines where alerts are sent.
-
Notification Policy: A set of rules that define when and how alerts are routed to contact points. You can use labels to target specific alerts.
-
Alert Rule: A condition-based rule that triggers when certain thresholds or conditions are met within Grafana's data (in our example we are looking for any NotReady node in our cluster).
resource "grafana_contact_point" "contact_point_0" {
  name = "demo-contact-point"

  email {
    addresses    = ["amine.nefzi.e@thalesdigital.io"]
    single_email = false
  }
}

resource "grafana_notification_policy" "notification_policy_1" {
  contact_point = grafana_contact_point.contact_point_0.name
  group_by      = ["grafana_folder", "alertname"]
  policy {
    contact_point = grafana_contact_point.contact_point_0.name
    group_by      = ["grafana_folder", "alertname"]
    matcher {
      label = "severity"
      match = "="
      value = "critical"
    }
  }
}

resource "grafana_folder" "rule_folder" {
  title = "My Alert Rule Folder"
}

resource "grafana_rule_group" "rule_group_0000" {
  org_id           = null
  name             = "test-group"
  folder_uid       = grafana_folder.rule_folder.uid
  interval_seconds = 300

  rule {
    name      = "test-rule"
    condition = "C"

    data {
      ref_id = "A"

      relative_time_range {
        from = 600
        to   = 0
      }

      datasource_uid = "k8saas-tdf-k8saas-prometheus"
      model          = "{\"datasource\":{\"type\":\"prometheus\",\"uid\":\"k8saas-tdf-k8saas-prometheus\"},\"editorMode\":\"code\",\"expr\":\"kube_node_status_condition{condition=\\\"Ready\\\", status=\\\"true\\\", cluster=\\\"k8saas-am-moni-sandbox\\\"} == 0\",\"instant\":true,\"intervalMs\":1000,\"legendFormat\":\"__auto\",\"maxDataPoints\":43200,\"range\":false,\"refId\":\"A\"}"
    }
    data {
      ref_id = "B"

      relative_time_range {
        from = 600
        to   = 0
      }

      datasource_uid = "__expr__"
      model          = "{\"conditions\":[{\"evaluator\":{\"params\":[],\"type\":\"gt\"},\"operator\":{\"type\":\"and\"},\"query\":{\"params\":[\"B\"]},\"reducer\":{\"params\":[],\"type\":\"last\"},\"type\":\"query\"}],\"datasource\":{\"type\":\"__expr__\",\"uid\":\"__expr__\"},\"expression\":\"A\",\"intervalMs\":1000,\"maxDataPoints\":43200,\"reducer\":\"last\",\"refId\":\"B\",\"type\":\"reduce\"}"
    }
    data {
      ref_id = "C"

      relative_time_range {
        from = 600
        to   = 0
      }

      datasource_uid = "__expr__"
      model          = "{\"conditions\":[{\"evaluator\":{\"params\":[0],\"type\":\"gt\"},\"operator\":{\"type\":\"and\"},\"query\":{\"params\":[\"C\"]},\"reducer\":{\"params\":[],\"type\":\"last\"},\"type\":\"query\"}],\"datasource\":{\"type\":\"__expr__\",\"uid\":\"__expr__\"},\"expression\":\"B\",\"intervalMs\":1000,\"maxDataPoints\":43200,\"refId\":\"C\",\"type\":\"threshold\"}"
    }

    no_data_state  = "NoData"
    exec_err_state = "Error"
    for            = "5m"
    annotations = {
      description = ""
      runbook_url = ""
      summary     = "Node {{ $labels.node }} is not ready in cluster k8saas-am-moni-sandbox"
    }
    labels = {
      severity = "critical"
    }
    is_paused = false
  }
}
    variable "token" {
    type      = string
    nullable  = false
    sensitive = true
    }
    variable "url" {
    type      = string
    nullable  = false
    sensitive = false
}
Configure the grafana provider: url: The URL of grafana dashboard auth: This is the token that we previously craeted
provider "azurerm" {
  features {
    resource_group {
      prevent_deletion_if_contains_resources = false
    }
  }
}

provider "grafana" {
  url = var.url
  auth = var.token
}
terraform {
  required_providers {
    azurerm = {
      source  = "hashicorp/azurerm"
      version = "~> 3.86"
    }
    grafana = {
      source = "grafana/grafana"
      version = "3.7.0"
    }
  }
  required_version = ">= 1.1.0"
}
Accees to the gitlab project
- Apply and check if the resources are created as expected
You create all grafana resources from the UI then export then on HCL format.
Example: Import an Alert rule
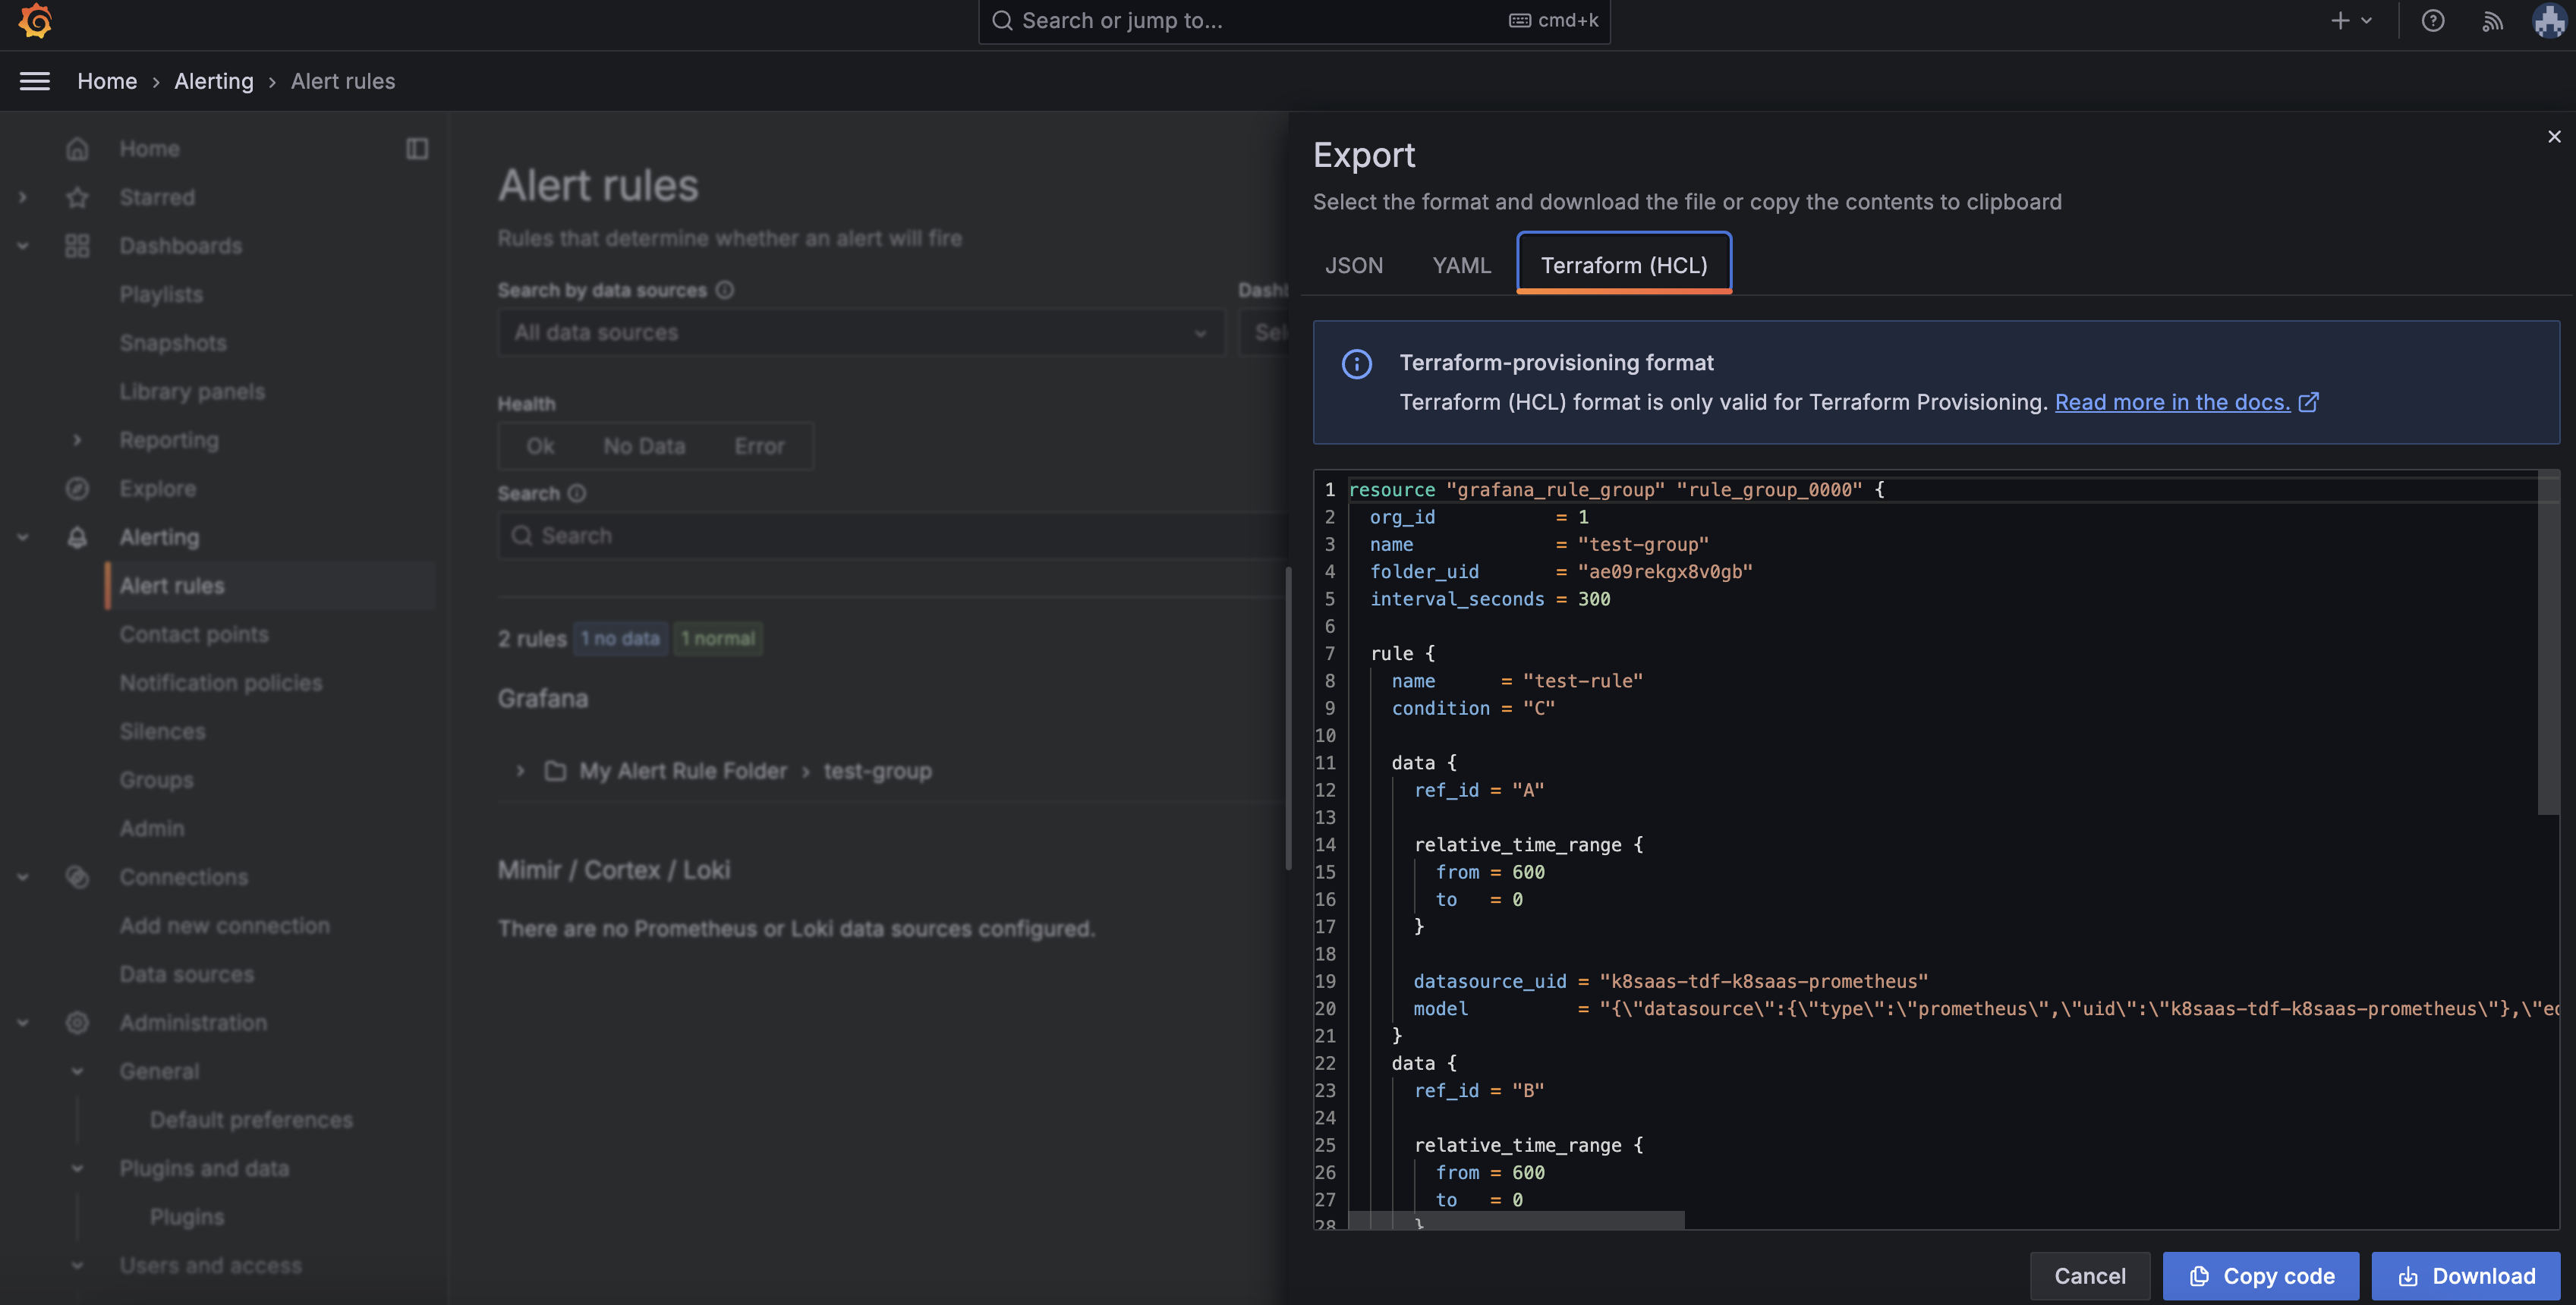
As you notice we set the org_id to null, this is because the org_id is scoped with the auth token.
Key Differences in Grafana 10 (default version when choosing managed monitoring): Unified Alerting: Grafana 10 introduces a unified alerting system that allows managing alert rules, notification policies, and contact points in one place, making it easier to scale alerting across multiple dashboards. Contact Points and Notification Policies: In Grafana 10, notifications are managed via Contact Points and Notification Policies, giving more control over how alerts are grouped, escalated, or silenced. Multi-condition Alerts: You can now create more advanced alert conditions that evaluate multiple queries and use logical operators to trigger alerts.
Limitations
- This feature is not yet fully mature, stability and maturity will be a key focus of the next release.
- Not fully automated: dashboards and Alerts are added manually at the moment and some promethues rule must be created to use public grafana dashboard ( nginx ingress)
- No private access (no private endpoint)
- Baseline infrastructure has not enough resources to prometheus exporter and oms
- Azure use own crd to service/pod monitor. Due to azure prometheus billing rule only a few COTS should be configured to use new crds
- nginx
- flux
- Grafana enterprise is disabled
- Installing, uninstalling and upgrading plugins from the Grafana Catalog isn't possible
- All users must have accounts in Microsoft Entra ID. Third-party accounts aren't supported. As a workaround, use the default tenant of your Azure subscription with your Grafana instance and add other users as guests.
- Azure Managed Grafana currently doesn't support the Grafana Role Based Access Control (RBAC) feature and the RBAC API is therefore disabled.
Conclusions
By following these steps, you can quickly get started with Azure Managed Prometheus and Azure Managed Grafana for monitoring AKS clusters and workloads. This setup allows you to visualize performance metrics, monitor logs, set up alerts, and gain actionable insights with minimal infrastructure overhead. These fully managed services provide a scalable and secure solution to meet your Kubernetes monitoring needs.