How to Specifying a Disruption Budget for your Application
In this document, pod disruption budget deployment and best practices will be explained.
What is a PodDisruptionBudget ?
A Pod Disruption Budget (PDB) allows you to limit the disruption to your application when its pods need to be rescheduled for some reason such as upgrades or routine maintenance work on the Kubernetes nodes.
Disruptions official documentation
How to create PDB
As an application owner, you can create a PodDisruptionBudget (PDB) for each application. A PDB limits the number of Pods of a replicated application that are down simultaneously from voluntary disruptions.
Example:
As prerequisites, you must either have already deployed a Deployment, or a ReplicaSet or a StatefulSet.
The pdb will bi tied to the deployment using the label selector.
You can follow this guide to deploy a simple application : hello world app
[!NOTE] The dev namespace that we reference in this document should be a customer namespace that was created under customer-namespaces using hns. $ kubectl hns create dev -n customer-namespaces
Check if the deployment is ready:
kubectl get deployments.apps -n dev
NAME                 READY   UP-TO-DATE   AVAILABLE   AGE
aks-helloworld-one   1/1     1            1           4d23h
Deploy the pdb:
cat <<EOF | kubectl apply -f -
apiVersion: policy/v1
kind: PodDisruptionBudget
metadata:
  name: zk-pdb
spec:
  minAvailable: 2
  selector:
    matchLabels:
      app: aks-helloworld-one
EOF
Check the pdb :
kubectl get pdb -n dev
NAME     MIN AVAILABLE   MAX UNAVAILABLE   ALLOWED DISRUPTIONS   AGE
zk-pdb   2               N/A               0                     51m
In this case the configuration is inadequate because 'ALLOWED DISRUPTIONS' output is equal to 0, but it should be at least equal to 1.
So we need to update the number of replicas of the deployment :
kubectl scale deployment -n dev aks-helloworld-one --replicas=3

kubectl get pdb -n dev
NAME     MIN AVAILABLE   MAX UNAVAILABLE   ALLOWED DISRUPTIONS   AGE
zk-pdb   2               N/A               1                     60m
Now the 'ALLOWED DISRUPTIONS' output is equal to 1 because we have 3 replicas and the minimum available is 2.
Below you can find the documentation, you can see more examples and details about pdb.
‼️ A bad configuration of PDB can disturb operation actions that's why you need to follow best practices and be sure of your configuration. The configuration is problematic when ALLOWED DISRUPTIONS == 0.
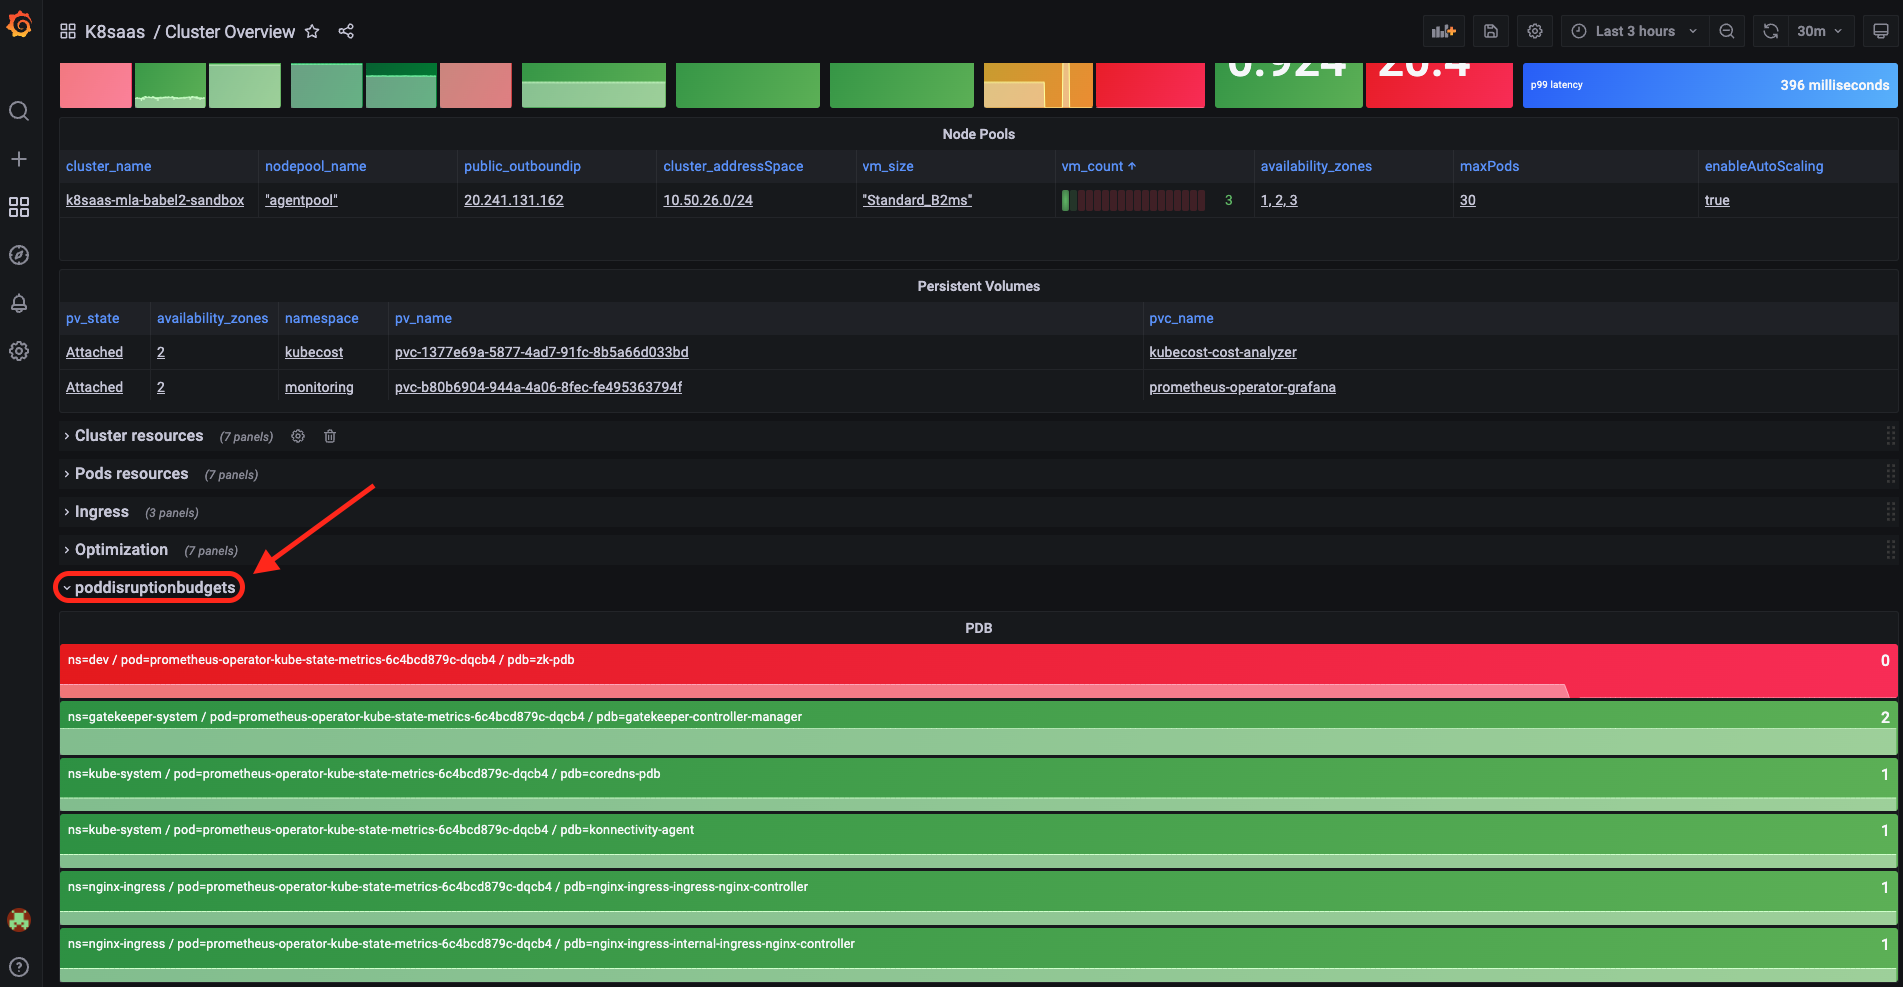
PDB monitoring
From your grafana UI your can access to several dashboards, from the Cluster Overview dashboard you can see your PDBs. If it appears in red, it means that is misconfigured. In this case you need to review the configuration in order to avoid blocking operations.